
HP-UX Workload Manager User's Guide


Monitoring SLO compliance and WLM
Monitoring WLM with the wlminfo command
Chapter 10 345
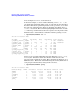
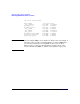
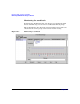
Note also that beginning with WLM A.03.02 you can use the -v option
with the wlminfo group command to see the minimum and maximum
percentage of CPU resources (gmincpu and gmaxcpu) and the minimum
and maximum percentage of memory (gminmem and gmaxmem) assigned
for each group, if applicable in the active configuration (if a minimum or
maximum is not assigned, wlminfo displays “-” in place of a numeric
value; if memory management is not being used for a group, wlminfo
displays a “-” in the ‘Mem Shares’ column). Because the width of the
display exceeds 80 characters, the wlminfo group -v command displays
the information in long-line format, each row wrapping to the next line
as in the following example:
% /opt/wlm/bin/wlminfo group -v
Tue Jun 11 16:06:27 2006
Workload Group PRMID CPU Shares CPU Min CPU Max CPU Util Mem Shares
Mem Min Mem Max Mem Util State
OTHERS 1 432.00 - - 171.34 40.00
- - 30.21 ON
g_nice 2 84.00 10 80 49.22 15.00
10 20 4.89 ON
g_nightly 3 0.00 - - 0.00 -
10 20 - ON
g_team 4 6.00 2 4 0.00 15.00
2 10 0.00 ON
g_apache 3 72.00 10 55 0.00 29.00
4 15 0.00 ON
_IDLE_ 7 6.00 - - 0.00 1.00
1 - 0.00 ON
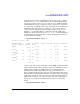
Last, we look at the metrics used in the current WLM configuration. The
‘PID’ column shows the PID of the data collector providing the metric to
WLM. In this example, the WLM daemon, wlmd, with PID 2103 is
providing many of the metrics itself, for usage goals. (Because wlmd
starts, and then starts the data collectors, wlmd typically has the lowest
PID.) The ‘State’ column indicates whether the metric value was updated
in the interval (NEW), no value has been received for the metric since the
WLM daemon started (INIT), or the metric’s value was not updated in
the interval (OLD). The last column shows the value received for the
metric.
% /opt/wlm/bin/wlminfo metric