
HP-UX Workload Manager User's Guide


Monitoring SLO compliance and WLM
Monitoring WLM with the wlminfo command
Chapter 10344
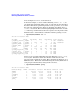
A few examples of wlminfo are shown below.
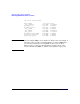
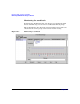
In the first example, we focus on SLOs. Entering wlminfo slo -v, we
get output that includes the SLOs’ goals, as well as the metrics that show
how the workloads are performing relative to the goal. Also, we see from
the ‘Concern’ column that two SLOs are Disabled, most likely due to a
condition statement. This column helps highlight information. A dash
(-) in the ‘Req’ column indicates that no requests are being made for the
SLO. The ‘State’ column indicates whether an SLO is passing or is off.
% /opt/wlm/bin/wlminfo slo -v
Tue Jun 11 16:06:09 2006
SLO Name Group Pri Metric Goal Req Shares State Concern
s_nightly_kickof g_nightl 1 - - - 0 OFF Disabled
s_nightly_run g_nightl 1 30.5 75 - 0 OFF Disabled
s_apache_10min g_apache 2 7 - 72 72 PASS
s_apache_2min g_apache 2 0 - 72 72 PASS
s_nice g_nice 2 30.5 50 30 30 PASS
s_others OTHERS 2 1.35 50 433 462 PASS
s_team_playgroun g_team 2 0 75 1 30 PASS
s_apache_more g_apache 3 0 - 72 72 PASS
s_nice_xtra_min g_nice 3 - - 30 30 PASS
s_team_playgroun g_team 3 - - 30 30 PASS
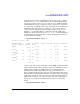
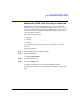
Now we focus on workloads/workload groups. Entering wlminfo group,
we see by the ‘CPU Util’ column the amount of CPU resources the
processes in the workloads are using. This command also displays (as of
WLM A.03.02) a ‘Mem Util’ column indicating the memory utilization of
each group for which memory management is in effect.
% /opt/wlm/bin/wlminfo group
Tue Jun 11 16:06:27 2006
Workload Group PRMID CPU Shares CPU Util Mem Shares Mem Util State
OTHERS 1 432.00 171.34 40.00 30.21 ON
g_nice 2 84.00 49.22 15.00 4.89 ON
g_nightly 3 0.00 0.00 0.00 0.00 OFF
g_team 4 6.00 0.00 15.00 0.00 ON
g_apache 5 72.00 0.00 29.00 0.00 ON
_IDLE_ 7 6.00 0.00 1.00 0.00 ON