
HP-UX Workload Manager User's Guide


Chapter 10 343
10 Monitoring SLO compliance and
WLM
WLM allows you to monitor SLO compliance and much more information
through wlminfo, wlmgui, and EMS, as described in the following
sections:
• “Monitoring WLM with the wlminfo command” on page 343
• “Monitoring WLM with the wlmgui command” on page 347
• “Monitoring WLM with EMS” on page 354
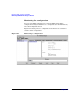
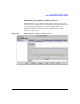
Monitoring WLM with the wlminfo command
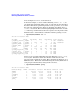
The wlminfo command provides various WLM data, with reports
focusing on SLOs, metrics, or workloads. The command has both a
command-line interface and a graphical interface.
For information on wlminfo options and output, see wlminfo(1M).
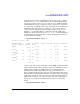
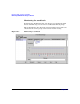
NOTE To ensure the smooth running of the operating system and key HP-UX
daemons, WLM runs these system processes in a special workload called
PRM_SYS. This group is not restrained by WLM: It consumes system
resources as needed. As a result, a workload’s CPU usage (shown in the
‘CPU Util’ column) may be less than its CPU shares because PRM_SYS
requires some of the group’s resources. However, the low usage could also
be the result of the group’s low CPU resource demands, or a combination
of the two factors. Also, CPU usage might at times be slightly above the
shares value due to dynamics in the CPU scheduler that WLM uses.
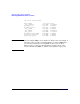
Likewise, if memory management is enabled, a workload’s memory
usage may be less than the number of memory shares for reasons similar
to those just stated. It could also be slightly above the memory shares
value due to extreme paging pressure or when the current group
allocation is being reduced.