
HP-UX Workload Manager User's Guide


WLM quick start: the essentials for using WLM
Monitoring WLM
Chapter 2106
wlminfo
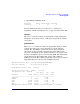
The wlminfo command, available in /opt/wlm/bin/, displays information
about SLOs, metrics, workload groups, virtual partitions or nPartitions,
and the current host. To display information about workload groups,
specify the group keyword as in the following example. Note that as of
WLM A.03.02 you can use the -v option with the wlminfo group
command to display gmincpu, gmaxcpu, gminmem, and gmaxmem values, if
they are assigned in the active configuration file).
# wlminfo group
Workload Group PRMID CPU Shares CPU Util Mem Shares Mem Util State
OTHERS 1 65.00 0.00 6.00 2.10 ON
g2 2 15.00 0.00 64.00 32.43 ON
g3 3 20.00 0.00 30.00 9.17 ON
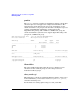
To display information about partitions, specify the par keyword. In the
following example, the ‘Intended Cores’ column shows the number of
CPU resources (cores) that WLM wants to allocate to the partition, while
the ‘Cores’ column shows the current number of active cores. The number
of intended and active cores is usually the same except when WLM is in
the process of modifying a partition or is operating in passive mode. (In
passive mode, the intended core allocation is not made; the partition
retains the current number of active cores.) The ‘Cores Used’ column
shows the CPU (core) utilization of the partition. The ‘Interval’ column
shows the WLM interval—the frequency at which WLM checks for new
performance data for the workload and then adjusts core allocations.
# /opt/wlm/bin/wlminfo par
Hostname Intended Cores Cores Cores Used Interval
north 2 2 1.3 6
south 3 3 2.1 6
east 1 1 0.4 6
west 2 2 1.7 6
northwest 3 3 2.3 6
northeast 2 2 1.4 6
The wlminfo host command displays information pertaining to the local
host (default) or a specified host, including the number of CPU resources
(cores) on the host and the number being used as well as the WLM
interval, as in the following example (for local host west):