
HP-UX Workload Manager overview


21
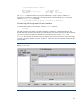
% /opt/wlm/bin/wlminfo metric
Metric Name PID State Value
fin_app.deposit.trans_se 27571 NEW 1.8
_CPU_Sales 27570 NEW 22.695808
The wlminfo command enables you to specify multiple SLOs, groups, metrics, partitions, or
processes. For example, to display data about groups Finance and Marketing, you can enter the
following wlminfo group command:
% /opt/wlm/bin/wlminfo group –g Finance –g Marketing
Monitoring with the graphical user interface
To use the WLM graphical user interface, enter the wlmgui command:
% wlmgui
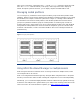
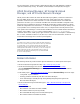
The WLM graphical user interface provides monitoring in addition to configuration features. The
Monitor tab of the graphical user interface provides graphs of allocation and usage for the workloads
(you can also graph a workload’s minimum CPU and maximum CPU values (gmincpu and
gmaxcpu). For example, the CPU Resources tab displays how many CPU resources (cores) have been
active for a particular partition over time. In Figure 4, active CPU resources remained constant for the
given partition.
Figure 4. Monitoring WLM