
HP-UX Workload Manager overview
20
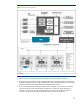
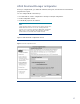
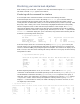
In the following example, the focus is on partitions (hosts). The wlminfo par command displays
information about each nPartition or virtual partition that WLM manages. The Intended Cores column
shows the number of cores that WLM wants to allocate to the partition, while the Cores column shows
the current number of active cores. The number of intended and active cores is usually the same,
except when WLM is in the process of modifying a partition or is operating in passive mode. (In
passive mode, the intended core allocation is not made; the partition retains the current number of
active cores.) The Cores Used column shows the CPU (core) utilization of the partition. The Interval
column shows the WLM interval, which is the frequency at which WLM checks for new performance
data for the workload and then adjusts core allocations.
% /opt/wlm/bin/wlminfo par
Hostname Intended Cores Cores Cores Used Interval
north 2 2 1.3 6
south 3 3 2.1 6
east 1 1 0.4 6
west 2 2 1.7 6
northwest 3 3 2.3 6
northeast 2 2 1.4 6
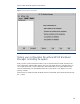
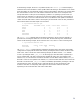
The wlminfo host command displays information pertaining to the local host (by default) or a
specified host, including the number of cores on the host, the amount being used, and the WLM
interval. In the following example, the local host has two cores, with 1.7 of the cores being used:
% /opt/wlm/bin/wlminfo host
Hostname Cores Cores Used Interval
localhost 2 1.7 6
The wlminfo metric command displays information about the metrics used in the current WLM
configuration. It displays the PID of the data collector providing the metric to WLM, the status of the
metric value, and its current value. In the following example, the WLM daemon, wlmd, with PID
27570 is providing the metric _CPU_Sales for the usage goal. The other metric is updated by a
process outside WLM. The State column indicates whether the metric value was updated in the
interval (NEW), no value has been received for the metric since the WLM daemon started (INIT), or
the metric’s value was not updated in the interval (OLD). The last column shows the value received for
the metric. The value for the _CPU_Sales metric (22.695808) represents the percentage of its CPU
allocation that it is using. The metric value is well under the goal of using at least 60% of the
workload’s allocation. Consequently, WLM might soon decrease the workload’s allocation,
depending on the current allocation and needs of other SLOs.