
HP-UX Workload Manager overview
19
Monitoring your service level objectives
WLM enables you to monitor SLO compliance and other information through its wlminfo command
line interface and the wlmgui graphical user interface.
Monitoring with the command line interface
A few examples of the command line interface are shown in the following discussion.
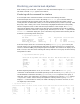
In the first example, the focus is on SLOs. By entering wlminfo slo, you can see the number of
shares requested in the Req (request) column. The Shares column indicates the number of shares
actually allocated. From the State column, you can see that the two priority 1 SLOs are passing, while
the priority 2 SLO is failing. The Concern column helps to highlight information that could possibly
indicate configuration issues or other issues that require attention. In this example, the Priority
entry indicates that the shares granted are less than what was requested because WLM is satisfying
requests from other SLOs at the same or higher priority. Note that you can use the –v option with the
wlminfo slo command to display the goals of the SLOs (if any) and the metrics showing how the
workloads are performing relative to the goals.
% /opt/wlm/bin/wlminfo slo
SLO Name Group Pri Req Shares State Concern
finance_deposit Finance 1 52 53 PASS
sales_analysis Sales 1 20 20 PASS
marketing_analysis Marketing 2 30 26 FAIL Priority
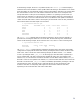
In the next example, the focus is on workloads. By entering wlminfo group, you can see by the
CPU Util column (“Util” represents utilization) that all the user-defined workloads are consuming CPU
resources, with the OTHERS group having the highest consumption. The command also displays (as of
WLM A.03.02) a Mem Util column indicating the memory utilization of each group for which memory
management is in effect.
% /opt/wlm/bin/wlminfo group
Workload Group PRMID CPU Shares CPU Util Mem Shares Mem Util State
OTHERS 1 432.00 171.34 40.00 30.21 ON
g_nice 2 84.00 49.22 15.00 4.89 ON
g_nightly 3 0.00 0.00 0.00 0.00 OFF
g_team 4 6.00 0.00 15.00 0.00 ON
g_apache 5 72.00 0.00 29.00 0.00 ON
_IDLE_ 7 6.00 0.00 1.00 0.00 ON
Note that beginning with WLM A.03.02 you can use the –v option with the wlminfo group
command to see the minimum and maximum percentage of CPU resources (gmincpu and gmaxcpu)
and the minimum and maximum of memory (gminmem and gmaxmem) assigned for each group, if
applicable, in the active configuration. (If a minimum or maximum is not assigned, wlminfo displays
“-“ in place of a numeric value; if memory management is not being used for a group, wlminfo
displays a “-“ in the Mem Shares column.) The width of the display exceeds 80 characters, so each
row might wrap to the next line.
% /opt/wlm/bin/wlminfo group –v
Workload Group PRMID CPU Shares CPU Min CPU Max CPU Util Mem Shares Mem Min Mem Max Mem Util State
OTHERS 1 432.00 - - 171.34 40.00 - - 30.21 ON
g_nice 2 84.00 10 80 49.22 15.00 10 20 4.89 ON
g_nightly 3 0.00 - - 0.00 - 10 20 - ON
g_team 4 6.00 2 4 0.00 15.00 2 10 0.00 ON
g_apache 3 72.00 10 55 0.00 29.00 4 15 0.00 ON
_IDLE_ 7 6.00 - - 0.00 1.00 1 - 0.00 ON