
HP-UX Workload Manager overview

14
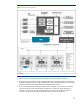
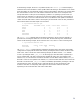
3. For the application running with a metric goal, a data collector reports the application’s metrics.
The measurement, for example, might be transaction response times for an online transaction
processing (OLTP) application.
4. For each metric goal, WLM creates a controller. You assign a data collector to track and report a
workload’s performance. Each controller receives the metric from the respective data collector. The
metric is compared to the metric’s goal to determine how a workload’s application is performing.
If the application is performing below expectations, the controller then requests an increase in CPU
allocations for the workload; if the application is performing above expectations, the controller
requests a decrease in CPU allocations for the workload.
5. For applications without goals, WLM requests CPU resources based on the CPU shares requested
in the SLO definitions. These requests could be for fixed allocations or for shares-per-metric
allocations, with the metric coming from a data collector.
6. The arbiter, an internal module of WLM (not to be confused with the global arbiter used for
managing resources across partitions), collects all the requests for CPU shares. These requests
come from controllers or, if allocations are fixed, from the SLO definitions. The arbiter satisfies the
requests based on priority. If resources are insufficient for every application to meet its goals, the
arbiter satisfies the highest priority requests first. If multiple SLOs at the same priority cannot be
satisfied, WLM raises the CPU allocation for each SLO’s associated workload to the same level or
to the SLO’s CPU request—whichever is smaller.
7. Optionally, with PRM resource management available for a single HP-UX instance, WLM
determines how much memory to distribute to meet the minimum memory requests and then, if any
memory remains, divides it among the workload groups with active SLOs.
8. For managing resources within a single HP-UX instance, WLM then creates a new PRM
configuration that applies the new CPU and (optional) memory shares for the various workload
groups.
9. For managing CPU resources (cores) across partitions, the WLM process flow described in the
preceding steps is duplicated in each partition. The WLM instance in each partition regularly
requests from the WLM global arbiter a certain number of cores for its partition. The global arbiter
then uses these requests to decide how to allocate cores to the various partitions. Next, it adjusts
each partition’s number of cores to better meet the SLOs in the partition.
For partitions, you can bypass creating workloads (workload groups), treating the partition itself
(and applications that run on it) as the workload. Par 2 and Par 3 show this scenario.
The monitoring and logging processes shown in Figure 1 include the following:
• The status of the SLOs and information about the performance of WLM are sent to the Event
Monitoring Service (EMS). Using an EMS client such as System Administration Manager (SAM) or
System Management Homepage (SMH), which is an enhanced version of SAM, you can choose
from several notification methods (such as email, SNMP traps, TCP, User Datagram Protocol (UDP),
and OPC Messaging) for receiving events of specific interest.
• The WLM monitoring command line utility wlminfo or the graphical user interface wlmgui
enables you to get a variety of types of WLM information.
• WLM keeps you up to date on the operations of its daemon by updating the message log in
/var/opt/wlm/msglog.
• WLM adds data to the statistics log in /var/opt/wlm/wlmdstats if enabled through the wlmd -l
option. The data collectors continue to feed application metrics to WLM, which periodically
calculates new resource allocations and performs any needed PRM reconfiguration.
• WLM produces audit data in /var/opt/wlm/audit if the WLM configuration file is activated using
the -t option to wlmd.
• WLM produces audit data in /var/opt/wlm/wlmpardstats/ if the WLM global arbiter configuration
file is activated using the -l option to wlmpard.