
Veritas Volume Manager 4.1 Administrator's Guide (HP-UX 11i v3, February 2007)

Chapter 3, Administering Dynamic Multipathing (DMP)
Administering DMP Using vxdmpadm
117
Gathering and Displaying I/O Statistics
You can use the vxdmpadm iostat command to gather and display I/O statistics for a
specified DMP node, enclosure or path.
To enable the gathering of statistics, enter this command:
# vxdmpadm iostat start [memory=size]
To reset the I/O counters to zero, use this command:
# vxdmpadm iostat reset
The memory attribute can be used to limit the maximum amount of memory that is used
to record I/O statistics for each CPU. The default limit is 32k (32 kilobytes) per CPU.
To display the accumulated statistics at regular intervals, use the following command:
# vxdmpadm iostat show {all | dmpnodename=dmp-node | \
enclosure=enclr-name | pathname=path_name}
[interval=seconds [count=N]]
This command displays I/O statistics for all controllers (all), or for a specified DMP
node, enclosure or path. The statistics displayed are the CPU usage and amount of
memory per CPU used to accumulate statistics, the number of read and write operations,
the number of blocks read and written, and the average time in milliseconds per read and
write operation.
The interval and count attributes may be used to specify the interval in seconds
between displaying the I/O statistics, and the number of lines to be displayed. The actual
interval may be smaller than the value specified if insufficient memory is available to
record the statistics.
To disable the gathering of statistics, enter this command:
# vxdmpadm iostat stop
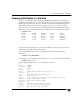
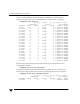
Examples of Using the vxdmpadm iostat Command
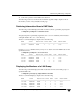
The follow is an example session using the vxdmpadm iostat command. The first
command enables the gathering of I/O statistics:
# vxdmpadm iostat start