
VERITAS Volume Manager 3.5 User's Guide - VERITAS Enterprise Administrator (September 2004)

Getting Started with VxVM VEA
Performance Tuning
Chapter 2 41
The average time in microseconds that it takes to process a read
block from the time a request is made until the data is returned.
• Avg Time (microseconds)/Write Block
The average time in microseconds that it takes to process a read
block from the time a request is made until the data is returned.
By default, all the statistical parameters will be enabled.
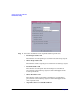
Step 3. Set I/O Refresh Rate/Sec.
This is the time interval of the refresh of the data collection screen
display. The program continuously runs the actual statistics in the
background, but changes the display of them on the Online Monitoring
according to the refresh rate you set.
Step 4. Set Threshold.
The Threshold is the minimum amount of I/O per second that a disk or
subdisk has to have to display a color other than blue. Blue is the lowest
state, Low I/O activity. The default threshold is 15.
Step 5. Set Hot spot indicator based on category.
Step 6. When you are finished with your changes, click OK.
Viewing Real-Time Statistics
You can view real-time statistics in the Volume to Disk Mapping Window.
By default, the Volume to Disk Mapping Window comes up with
statistics collection switched off. To turn it on, you need to:
• Select the disk group to be monitored
• Select Actions > Disk/Vol Map
• Select:
— View > Collect Statistics
Statistics are accumulated from when they were reset (usually
they are reset when the system boots/reboots, or at object
creation, whichever is most recent).
— View > Compare on Refresh
Each statistic request is compared with the last one to determine
where the current high I/O activity is occurring.