
VERITAS Volume Manager 3.5 Administrator's Guide (September 2004)

Performance Monitoring and Tuning
Performance Monitoring
Chapter 12 393
VxVM also maintains other statistical data. For each plex, it records read
and write failures. For volumes, it records corrected read and write
failures in addition to read and write failures.
To reset the statistics information to zero, use the -r option. This can be
done for all objects or for only those objects that are specified. Resetting
just prior to an operation makes it possible to measure the impact of that
particular operation.
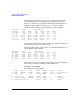
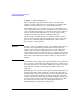
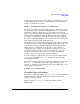
The following is an example of output produced using the vxstat
command:
OPERATIONS BLOCKS AVG TIME(ms)
TYP NAME READ WRITE READ WRITE READ WRITE
vol blop 00000.00.0
vol foobarvol 00000.00.0
vol rootvol 73017 181735 718528 1114227 26.8 27.9
vol swapvol 13197 20252 105569 162009 25.8 397.0
vol testvol 00000.00.0
Additional volume statistics are available for RAID-5 configurations.
For detailed information about how to use vxstat, refer to the vxstat
(1M) manual page.
Using Performance Data
When you have gathered performance data, you can use it to determine
how to configure your system to use resources most effectively. The
following sections provide an overview of how you can use this data.
Using I/O Statistics
Examination of the I/O statistics can suggest how to reconfigure your
system. You should examine two primary statistics: volume I/O activity
and disk I/O activity.
Before obtaining statistics, reset the counters for all existing statistics
using the vxstat -r command. This eliminates any differences between
volumes or disks due to volumes being created, and also removes
statistics from boot time (which are not usually of interest).
After resetting the counters, allow the system to run during typical
system activity. Run the application or workload of interest on the
system to measure its effect. When monitoring a system that is used for