
VERITAS Volume Manager 3.1 Storage Administrator Administrator's Guide

Getting Started
Viewing Objects and Object Properties
Chapter 2 67
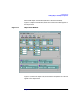
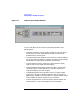
The Volume to Disk Mapping Window
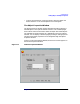
The Volume to Disk Mapping window displays a tabular view of volumes
and their underlying disks. Volumes are listed in the top row of the table
and disks are listed in the left column of the table. Each circle icon in the
table indicates that part of the corresponding volume is located on the
corresponding disk.
This window can also display details such as the subdisks and gaps (free
space) on each disk. Each subdisk or gap is listed with its disk offset and
length. When subdisks are shown, circles show the relationship between
volumes and subdisks.
The Volume to Disk Mapping window is dynamic, so the contents of this
window are automatically updated when objects are added, removed, or
changed.
The File menu prints information from the window or closes the window.
The View menu changes the way objects appear in the Volume to Disk
Mapping window. The context-sensitive Selected and popup menus
access tasks or properties for a selected object. To access the popup menu
for an object, right-click on the object.
The Volume to Disk Mapping window has a performance monitoring
feature that ranks volume response time. When performance monitoring
is turned on (View > Performance Monitoring), the icons in the table
change. The volumes with the slowest reads/writes are shown as red
icons. Volumes with relatively slow response time are shown as yellow
icons. All other volumes are shown as green icons.
Figure 2-5, Volume to Disk Mapping Window, shows how the
relationships between volumes and disks are shown in the Volume to
Disk Mapping window.