
HP-UX TCP/IP Performance White Paper, March 2008
35
Inbound Discards = 0
Inbound Errors = 0
Inbound Unknown Protocols = 881
Outbound Octets = 10832833
Outbound Unicast Packets = 132612
Outbound Non-Unicast Packets = 140
Outbound Discards = 0
Outbound Errors = 0
Outbound Queue Length = 2
Specific = 655367
Ethernet-like Statistics Group
Index = 1
Alignment Errors = 0
FCS Errors = 0
Single Collision Frames = 326
Multiple Collision Frames = 742
Deferred Transmissions = 0
Late Collisions = 0
Excessive Collisions = 0
Internal MAC Transmit Errors = 0
Carrier Sense Errors = 0
Frames Too Long = 0
Internal MAC Receive Errors = 0
The following fields should be small values if the system is running with optimal performance:
Inbound Discards
Inbound Errors
Outbound Discards
Outbound Errors
If there are excessive Inbound Discards, the system could be extremely busy or the system is under a packet
storm. See Section 3.3 “Protection from Packet Storms” for tuning recommendation.
Refer to lanadmin (1M) for additional options to display link level and DLPI statistics. They are useful in
identifying whether packets are being discarded at the link level or at the DLPI level.
6.2 Monitoring System Resource Utilization
Monitoring the utilization of system resources such as CPU, memory, caches etc is very essential to identify
performance bottlenecks. These bottlenecks must be well understood in order to improve the network
performance.
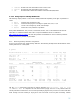
6.2.1 Monitoring CPU Utilization Using Glance
On HP-UX, glance(1) is a performance tool for displaying the breakdown of CPU utilization. Glance has
the following screens of metrics, which may be selected by pressing the labeled softkey or by typing the
following command:
• a (CPU BY PROCESSOR)
• c (CPU Report)