
FTAM/9000 Programmer's Guide

350 Chapter 9
Handling Errors
Using API Tracing
2. Within your program, enable tracing by changing the value of the
ft_trace variable from 0 to either API_TR_ENTRY_EXIT or
API_TR_INPUT. (The “Resolving FTAM Problems” chapter in the HP
FTAM/9000 User's Guide provides information on enabling and
disabling API tracing during an interactive FTAM session.)
3. If you want the trace output to be written to a file, redirect the trace
output from stderr as follows.
ft_trace_fp = fopen(“/tmp/my_ft_trace”,“a”);
4. If you want more than the first 16 bytes of data to be displayed,
increase the value of the ft_trace_max_udata variable. For example:
ft_trace_max_udata = 256
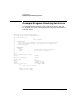
5. If you want API tracing to be a runtime option, use the -t option
shown in the following sample code, and enter program_name -t at
runtime.
The following example shows how to use the variables.
#include %<api_trace.h>
extern int ft_trace;
extern FILE *ft_trace_fp;
extern int ft_trace_max_udata;
..
main (argc,argv)
Int argc;
char **argv;
{
/* To run, enter “program name -t” to enable tracing*/
/* Check if tracing needs to be turned on */
if ((argc ==2) & & (strcmp(argv{1}, “-t”) == 0))
{
/* Turn tracing on, create trace file */
ft_trace = API_TR_INPUT;
ft_trace_fp = fopen(“/tmp/my_trace_file”, “a”);
ft_trace_max_udata = 256
else
ft_trace = 0 /*To be safe, always initialize it*/
/*Then do whatever you have to do*/
}
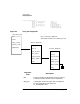
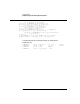
Interpreting the Trace File
Every time a routine is entered and exited, the time (in hh:mm:ss
format) and the name of the call are shown. First the -> arrow indicates
the beginning of the call, then the input parameters are shown, and then
the %<- arrow indicates the exit. The number following the %<- arrow is