
HP-UX 11i v3 Memory Management Subsystem

4
Top
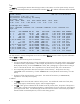
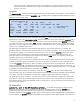
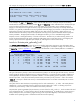
The top(1) command gives statistics about the top processes on the system, as well as system memory size and
utilization. For the example below, the command was invoked as
top -h, to hide the information about individual
CPUs.
System: vmkona1 Wed Jan 6 10:42:36 2010
Load averages: 0.29, 0.31, 0.26
353 processes: 275 sleeping, 78 running
Cpu states: (avg)
LOAD USER NICE SYS IDLE BLOCK SWAIT INTR SSYS
0.29 9.3% 0.0% 7.8% 82.9% 0.0% 0.0% 0.0% 0.0%
System Page Size: 4Kbytes
Memory: 100362036K (15489832K) real, 102756728K (16389916K) virtual, 127850076K free
Page# 1/26
CPU TTY PID USERNAME PRI NI SIZE RES STATE TIME %WCPU %CPU COMMAND
20 ? 114 root 152 20 72K 64K run 1:44 6.84 6.83 swapdaem
55 ? 2253 root -16 20 283M 259M run 6:02 6.56 6.54 midaemon
8 ? 134 root 152 20 2880K 2560K run 34:07 0.99 0.99 vxfsd
54 ? 1868 root 154 20 5592K 532K sleep 0:19 0.91 0.90 pwgrd
17 pts/th 22940 root 154 10 45616K 6080K sleep 0:07 0.83 0.83 glance
2 ? 1 root 152 20 2480K 656K run 0:10 0.66 0.66 init
36 ? 2315 root 152 0 47372K 7848K run 6:56 0.57 0.57 perfd
23 pts/ta 21072 oracle 152 20 63448K 8328K run 0:00 11.01 0.54 orabm
18 ? 2626 root 168 20 15424K 1180K sleep 10:15 0.48 0.47 utild
52 pts/tc 27689 root 178 20 10860K 1656K run 0:05 0.41 0.41 top
7 pts/ta 22343 oracle 158 20 4848K 564K sleep 0:04 0.28 0.28 sh
34 ? 0 root 127 20 72K 64K sleep 0:18 0.21 0.21 swapper
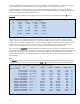
The data relevant to memory management are on the row labeled Memory and the columns of process information
labeled
SIZE and RES.
The Memory row shows three key pieces of information:
• how much real (physical) memory is being consumed by all processes in the system and how much of that is
considered "active" (in parentheses). In this example, all processes are consuming a total of 100362036
KB of physical memory, of which 15489832 KB is active, that is, belonging to a process that is running or
has run in the last 20 seconds. This is equivalent to 95.7 GB of memory used, with 14.8 GB active.
• the corresponding information about the consumption of virtual memory. The processes are using
102756728 KB of virtual memory, of which 16389916 KB is active (98 GB of virtual memory, 15.6 GB
active). .
• the amount of free physical memory in the system. The amount of free memory is 127850076 KB,
equivalent to 121.9 GB, which is plenty.
In addition:
• The SIZE column shows the total virtual size of the process. This includes the virtual sizes of text, data,
stack, mmap regions, shared memory regions, and I/O mapped regions.
• The RES column gives an indication of the resident size of the process, that is, the portion of the process's
memory that is currently occupying physical memory. Paging activity can occur at any time, so this figure is
just an approximate value. It is not meaningful to take a sum of these columns: each memory object that is
shared would be counted multiple times, once for each sharing process.