
HP-UX 11i v3 Memory Management Subsystem

13
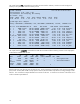
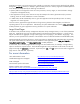
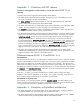
The output from glance shows that memory utilization is 99%.
Glance C.04.60.000 13:50:38 vmkona2 ia64 Current Avg High
--------------------------------------------------------------------------------
CPU Util SU U | 77% 77% 77%
Disk Util F FVV | 34% 26% 34%
Mem Util S SU U | 99% 99% 99%
Swap Util U UR R | 31% 31% 31%
--------------------------------------------------------------------------------
MEMORY REPORT Users= 4
Event Current Cumulative Current Rate Cum Rate High Rate
--------------------------------------------------------------------------------
Page Faults 97 410 12.9 50.0 447.1
Page In 113 243 15.0 29.6 61.4
Page Out 0 0 0.0 0.0 0.0
KB Paged In 452kb 972kb 60.2 118.5 2971.2
KB Paged Out 0kb 0kb 0.0 0.0 0.0
Reactivations 0 0 0.0 0.0 0.0
Deactivations 0 0 0.0 0.0 0.0
KB Deactivated 0kb 0kb 0.0 0.0 0.0
VM Reads 31 101 4.1 12.3 9.3
VM Writes 0 0 0.0 0.0 0.0
Total VM : 41.2gb Sys Mem : 12.6gb User Mem: 18.8gb Phys Mem : 31.7gb
Active VM: 29.7gb Buf Cache: 0mb Free Mem: 319mb FileCache: 1.5gb
Note that the amount of free memory is 319 MB, which is approximately 1% of the 31.7 GB of physical memory
available to the system. This is typical behavior for HP-UX: it will aggressively use memory to cache objects residing
in files, and will push memory objects out to disk only when the amount of free memory falls below the 1%
threshold. (Depending on the
patch level of HP-UX, the threshold value may be tunable by the system
administrator.)
The size of the filecache is 1.5 GB, approximately 5% of physical memory.
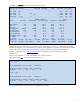
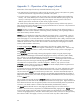
The output from the sar command completes the picture:
$ sar -q 60 1
HP-UX vmkona2 B.11.31 U ia64 02/26/10
13:45:04 runq-sz %runocc swpq-sz %swpocc
13:46:04 1.1 26 0.0 0
$ sar -w 60 1
HP-UX vmkona2 B.11.31 U ia64 02/26/10
13:46:04 swpin/s bswin/s swpot/s bswot/s pswch/s
13:47:04 0.00 0.0 0.00 0.0 587
During the measurement interval, there was no paging activity reported.