
HP-UX 11i v3 Memory Management Subsystem

8
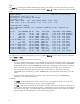
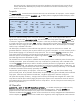
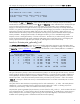
The following screen is for the Process Memory Regions, chosen by the keystroke M and then the PID 8121 to
examine an sqlplus process:
Glance C.05.00.000 10:49:36 vmkona1 ia64 Current Avg High
--------------------------------------------------------------------------------
CPU Util
S S
U U | 19% 21% 27%
Disk Util
F
| 2% 38% 100%
Mem Util
S S
U U
F F
| 52% 52% 52%
Swap Util
U U
RR | 48% 48% 48%
--------------------------------------------------------------------------------
Regions PID: 8121, sqlplus PPID: 3153 euid: 4000 User:oracle
Type RefCt RSS VSS Locked File Name
--------------------------------------------------------------------------------
NULLDR/Shared 166 4kb 4kb 0kb <nulldref>
MEMMAP/Shared 85 4kb 4kb 0kb /var/spool/pwgr/status
TEXT /Shared 3 4kb 4kb 0kb /opt/.../db/bin/sqlplus
DATA /Priv 1 1.8mb 2.1mb 0kb /opt/.../db/bin/sqlplus
UAREA /Priv 1 64kb 72kb 0kb <uarea>
MEMMAP/Priv 1 392kb 400kb 0kb /opt/.../timezlrg.dat
MEMMAP/Priv 1 16kb 24kb 0kb /usr/lib/tztab
MEMMAP/Priv 1 8kb 8kb 0kb <mmap>
Text RSS/VSS: 4kb/ 4kb Data RSS/VSS:1.8mb/2.1mb Stack RSS/VSS: 80kb/ 80kb
Shmem RSS/VSS: 0kb/ 0kb Other RSS/VSS: 21mb/ 54mb
Page 1 of 12
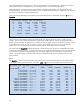
This example shows just the first page describing each of the memory objects used by the process. The RefCt
column is the reference count, the total number of processes that use the object (and the count includes the number
of references added by the filecache). The shared process
TEXT has a total of three references, while the private
objects have just one reference each. The
RSS column is the resident set size (that is, the approximate amount of
physical memory currently consumed by the process) and
VSS is the corresponding virtual size.
Sar
The system activity reporter, sar(1M), shows information about operating system activity. Of the many options,
the ones relevant to memory management are for processor run queue lengths and for swapping and switching
activity.
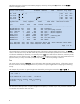
The example for processor run queue lengths was obtained by invoking the command as sar -q 60 1:
# sar -q 60 1
HP-UX vmkona1 B.11.31 U ia64 01/06/10
10:53:33 runq-sz %runocc swpq-sz %swpocc
10:54:33 1.6 7 0.0 0
The information about processor run queue lengths and occupancy is another way to view processor utilization, and
is consistent with what the other tools show.