
HP-UX 11i v3 Memory Management Subsystem

6
screen of interest. To examine the memory characteristics of a specific process, its process identifier (PID) must be
specified.
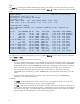
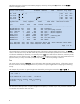
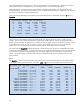
The following screen is for the Memory Report, selected by the keystroke m:
Glance C.05.00.000 10:45:40 vmkona1 ia64 Current Avg High
--------------------------------------------------------------------------------
CPU Util
S S
U U | 18% 21% 27%
Disk Util
F
| 2% 43% 100%
Mem Util
S S
U U
F F
| 52% 52% 52%
Swap Util
U U
RR | 48% 48% 48%
--------------------------------------------------------------------------------
MEMORY REPORT Users= 10
Event Current Cumulative Current Rate Cum Rate High Rate
--------------------------------------------------------------------------------
Page Faults 112823 22025420 18495.5 18293.5 23200.6
Page In 1 100 0.1 0.0 9657.7
Page Out 0 0 0.0 0.0 0.0
KB Paged In 4kb 400kb 0.6 0.3 101.2
KB Paged Out 0kb 0kb 0.0 0.0 0.0
Reactivations 0 0 0.0 0.0 0.0
Deactivations 0 0 0.0 0.0 0.0
KB Deactivated 0kb 0kb 0.0 0.0 0.0
VM Reads 0 0 0.0 0.0 0.0
VM Writes 0 0 0.0 0.0 0.0
Total VM : 98.0gb Sys Mem : 26.0gb User Mem: 95.7gb Phys Mem : 255.7gb
Active VM: 18.5gb Buf Cache: 0mb Free Mem: 121.9gb FileCache: 12.2gb
MemFS Blk Cnt: 0 MemFS Swp Cnt: 0 Page 1 of 1
The statistics shown here are fully consistent with those given by the top command. In addition to the 95.7 GB of
user memory, the Memory Report also shows that the operating system is using 26 GB (
Sys Mem). The overall
memory utilization (
Mem Util) is then calculated at 52%, which is comfortably low.
The information also agrees with the swapinfo command: the overall swap utilization is 48%. The current rate of
paging in is also low. The peak amount of page in activity, shown in the
High Rate column of the KB Paged
In row, corresponds to the demand paging generated by the startup of an application. glance reports absolutely
no page out activity, evidenced by the zeros in the
KB Paged Out row. This row reports the sum of the page outs
to swap space plus the page outs from the filecache. That filecache is using 12.2 GB of memory. (
glance reports
the value of the
filecache_min kernel tunable parameter if the actual filecache consumption is less than the
parameter value.)
To summarize the memory profile: of the 255.7 GB of physical memory, 37% is occupied by user processes, 10%
by the kernel, 5% by the filecache, and 48% is free.
Note that there are no process deactivations and reactivations. Nonzero entries on the Reactivations or
Deactivations lines would be an alarming signal, indicating that more physical memory is needed to support
the imposed workload.