
Smart Plug-in for WebLogic Server User's Guide

4-8
Chapter 4: Using HP OpenView Reporting and Graphing Features with WLS-SPI
Integrating WLS-SPI with HP OpenView Performance Manager
Integrating WLS-SPI with HP OpenView
Performance Manager
To use Performance Manager, you must separately purchase it, then complete
some tasks to configure the Web page display for the OVO console (UNIX
system). Some required tasks you have completed already. Specifically, the
required tasks are:
1. Set up the browser Web page display on the OVO console (UNIX system)
as explained in Chapter 2, Task 2: (optional) Configure the Management
Server to Launch your Web Browser,page2-5.
2. Configure the location of the graphing system within the WLS-SPI
configuration file, also explained in Chapter 2, Task 7: Configure Server
Connections and Graphs,page2-10.
3. Install the WebLogic Server SPI reporting/graphing package at the
Performance Manager Windows system by inserting the CD in the
CD-ROM drive and selecting Start
→Run→\<CD-ROM drive>:
\Products\
WLSSPI Performance Manager Package\setup.exe
and follow the instructions on screen.
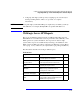
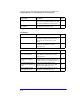
VIEWING GRAPHS THAT SHOW ALARM CONDITIONS
For graphing purposes, the WebLogic Server SPI organizes metrics according to
type and includes the following four groupings. When a message is generated for
any metric appearing in a table in the section that follows, you can view a chart
of its and other metric values.
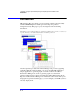
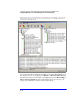
To view a graph associated with an alarm condition (Operator-initiated action
has been defined with the WLS-SPI monitor template), complete these steps:
1. In the OVO Message Browser double-click the message.
2. In the Message Details window select the Perform Action button.