
Smart Plug-in for WebLogic Server User's Guide

Chapter 4: Using HP OpenView Reporting and Graphing Features with WLS-SPI
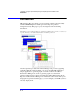
Integrating WebLogic Server SPI with Reporter to Generate Reports
4-7
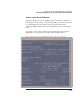
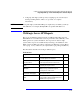
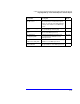
TOP 20 Servlet Request
Rate On Server
Shows a stacked area chart with the request
rate (requests per second) for the top 20
servlets for each day and a table with data
of the top 100 servlets for each WebLogic
Server.
242
Transaction Throughput On
Server
Shows the average transaction throughput
for each WebLogic Server by day.
76
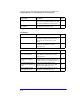
Transaction Rollback
Types
Shows the transaction rollbacks by error
type for each WebLogic Server.
72-75
EJB Transaction
Throughput By EJB
Charts the throughput (transactions per
second) for the top 20 EJBs for each
WebLogic Server.
227-230
TOP 20 EJB Transaction
Rollback Percent By EJB
Charts the transaction rollbacks for the top
20 EJBs for each WebLogic Server.
231-234
TOP 20 Stateless EJB
Cache Utilization
Shows the EJB cache utilization percent for
the top 20 EJBs for each WebLogic Server.
224
Report Title Description Metric