
Smart Plug-in for WebLogic Server User's Guide

Chapter 4: Using HP OpenView Reporting and Graphing Features with WLS-SPI
Integrating WebLogic Server SPI with Reporter to Generate Reports
4-5
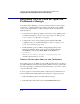
4. Add group and single system reports by assigning reports as desired. (See
the Reporter Help and the online Concepts Guide for complete
information.)
NOTE Group and single system WLS-SPI reports require that you identify systems by
their full name; for example, abc.xyz.com is acceptable while abc is not.
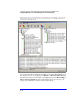
WebLogic Server SPI Reports
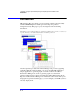
The reports available through the integration of HP OpenView Reporter and
WLS-SPI show consolidated data on server performance and availability on all
WebLogic Server systems. In addition, other reports show data for single
systems. These reports are available the day following your installation of the
WebLogic Server SPI report package on the Reporter Windows system. (Please
refer to page 4-3 if you have not yet completed the report package installation.)
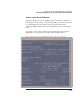
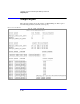
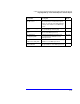
The three tables that follow show all pre-defined reports.
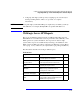
Performance
Report Title Description Metric
TOP 20 Queue Throughput Shows the average throughput for the top
20 execute queues of all servers.
10
TOP 20 Servlet Average
Execution Times
Shows the average execution time for the
top 20 requested servlets for all servers.
240
TOP 20 Servlet Request
Rates
Shows the total servlet request rate being
received by the top 20 servers.
242
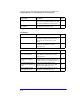
Execute Queue Thread
Utilization
Shows the execute queue`s thread
utilization as a percent for the top 20
execute queues of all servers.
11
TOP 20 Average
Transaction Throughput
Shows the average transaction throughput
for the top 20 servers.
76
TOP 20 EJB Free Pool Wait
Rate
Shows the number of times per minute that
a request had to wait for an EJB to become
available for the top 20 servers.
25