
Smart Plug-in for WebLogic Server User's Guide

1-8
Chapter 1: WebLogic Server SPI Concepts
How the SMART Plug-In for WebLogic Server Works
GRAPHING DATA WITH OPENVIEW PERFORMANCE
MANAGER
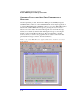
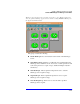
Another OpenView product, Performance Manager 4.0 (OVPM), integrates
with WLS-SPI to enable use of the WLSSPI Admin
→View Graphs application
to generate WLS-SPI graphs. OVPM also allows you to view WLS-SPI graphed
data from most WLS-SPI alarm messages by pressing the Perform Action
button. You see this button in both the Message Browser and in the message
details (access details by either double-clicking the message or selecting the
Details... button) in the Message Browser. The action launches your Web
browser, where you can choose a graph that shows values for the metric that
generated the message as well as other related metrics.
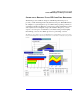
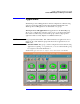
Metrics collected by WLS-SPI can be graphed. The values can then be viewed for
trend analysis