
Smart Plug-in for WebLogic Server Reference Guide


Chapter 1
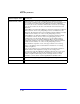
Metric B070_TranAveTime
1-55
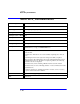
Metric B070_TranAveTime
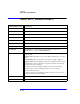
Monitor Template Name WLSSPI_0070
Metric Name Transaction Average Time
Metric Type Alarming, Reporting, Graphing
Description Average Commit time for transactions.
WebLogic 6.0/6.1 or Both Both
Severity: Condition Minor: WLSSPI-0070.1, threshold, 100 msec
Collection Interval 5m
Message Group WebLogic
Message Text WLSSPI-0070.1: Ave. commit time for transactions (<$VALUE>ms) too high
(>=<$THRESHOLD>ms)
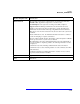
Instruction Text The average commit time for a transaction has exceeded the threshold value.
Probable cause: Thismaybeanindicationofsystemload.
Potential impact: Degradation in the transaction throughput rate for the
WebLogic Server.
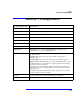
Suggested action: The administrator can monitor individual transactions from
the Adminstration Console. In addition to displaying statistics, the following
information can also be displayed:
1) Transactions by name, including rollback and time active information
2) Transactions by resource, including statistics on total, committed, and rolled
back transactions.
3) All active transactions, including information on status, servers, resources,
properties, and the transaction identifier.
Action Application Bank Report (ASCII report)
Area Transactions