
Smart Plug-in for WebLogic Server Reference Guide


1-42
Chapter 1
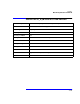
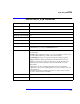
Metric B240_ServletAveExecTime
Metric B240_ServletAveExecTime
Monitor Template Name 240
Metric Name Servelet Average Execution Time
Metric Type Alarming, Reporting
WebLogic 6.0/6.1 or Both Both
Severity: Condition Warning: WLSSPI-0240.1, threshold 1000
Description Average execution time for a servlet in milliseconds.
Collection Interval 1h
Message Group WebLogic
Message Text WLSSPI-0240.1: Ave. execution time for a servlet (<$VALUE>ms) too high
(>=<$THRESHOLD>ms)
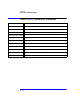
Instruction Text The average execution time for a servlet has exceeded the threshold value.
Probable cause: Application design issues.
Potential impact: Slow response time in returning an HTML or XML response
to the HTTP request from a client application.
Suggested action: The cause of high execution time for the servlet could be a
resource contention problem, or it could be due to the design of the servlet. You
may also choose to re-evaluate the threshold setting for this metric if values
consistently exceed the threshold value.
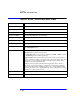
If JSPs are used extensively in the Web-based application, there could be a
performance impact due to having to compile the corresponding .jsp files into
Java servlet code, and then compiling the Java code to a Java class file. In this
situation, performance can be significantly improved by setting the server's java
compiler to sj or jikes instead of javac.
Action Application Bank Report (ASCII report)
Area Servlets