HP OPENVIEW SMART Plug-In for WebLogic Server Reference BB9145-90001 WebLogic Server SPI Reference Version A.01.
Legal Notices Hewlett-Packard makes no warranty of any kind with regard to this material, including, but not limited to, the implied warranties of merchantability and fitness for a particular purpose. Hewlett-Packard Co. shall not be liable for errors contained herein or for incidental or consequential damages in connection with the furnishing, performance, or use of this material.
Conventions Boldface Words in boldface type represent programs and commands. Capitalization Capitalized first letters represent company or product names. Computer font Words in computer font represent file or path names, command syntax statements, prompts or messages that appear on your screen, or text you should type on your workstation or terminal. Italics Words in italics represent variables in syntax statements or words that are emphasized in the text.
Printing History New editions are complete revisions of the manual. The printing dates for each edition are listed below.
Contents Chapter 1: WebLogic Server Metrics ........................................... 1-1 Introduction ...........................................................................................1-2 Metric Summary ....................................................................................1-3 Metric Specification Description ...........................................................1-8 Chapter 2: WebLogic Server SPI Log File and Configuration File Templates .......................................
ii
1 WebLogic Server Metrics
Chapter 1 Introduction Introduction This chapter provides detailed and summary listings of the WLS-SPI metrics and provides descriptions and other relevant information that will help you interpret the incoming WLS-SPI data. The information here should also prove valuable for customizing metric monitor templates.
Chapter 1 Metric Summary Metric Summary WLS-SPI metric monitor templates have pre-defined settings that simplify setup tasks for the WebLogic Server SPI. Over time, however, you may want to customize some of those settings. This and the section that follows provide the basic pieces of information you need for those customizations. For easy reference, the tables on the following pages list all metrics contained in the chapter.
Chapter 1 Metric Summary 6. 1 Ty /Bo th pe Se ve rit y 6. 0/ D es cr ip t io n N um b M er et r ic N am e .
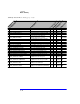
Chapter 1 Metric Summary 6. 1 Ty /Bo th pe Se ve rit y 6. 0/ io n ip t D es cr N um b M er et r ic N am e Summary WLS-SPI Metric Listing (page 2 of 4) # of times/min a client timed out waiting for an EJB bean 6.1 # of times/min a client timed out waiting for an EJB bean (drill down) 26 B226_EJBTimeoutRate 6.1 # of Entity EJB transactions per second (drill down) 27 B227_EJBEntityTranThruRt 6.1 # of MessageDriven EJB 28 B228_EJBMessageDrivenTranThruRt transactions per second (drill down) 6.
Chapter 1 Metric Summary 245 B245_WebAppSessionCnt 246 B246_WebAppHitRt 251 B251_JMSUtilByMessagePct 252 B252_JMSUtilByBytePct 253 B253_JMSThreshByMessagePct 254 B254_JMSThreshByBytePct 255 B255_JMSServerThruMessageRt 256 B256_JMSServerThruByteRt 260 B260_JDBCConnectionPoolUtil 61 B061_JDBCConPlWtCnt 262 B262_JDBCConnectionPoolThruRt 70 B070_TranAveTime 1-6 # of open sessions for a web application # of open sessions for a web application per second % of JMS server filled based on # of messages % of J
Chapter 1 Metric Summary 71 B071_TranRollbackPct 72 B072_TranResErrRbPct 73 B073_TranAppErrRbPct 74 B074_TranTimErrRbPct 75 B075_TranSysErrRbPct 76 B076_TranThruRate 77 B077_TranHeurCnt 80 B080_ClsOutMesFailRt 81 B081_ClsInMesFailRt 85 B085_InvLoginAttCnt 90 B090_TimeSerExcepCnt 91 B091_TimeSerThruRt 6.
Chapter 1 Metric Specification Description Metric Specification Description Each metric definition heading denotes a WebLogic Server metric number. The "B" that precedes the metric number designates the metric as a BEA WebLogic Server SPI metric. ! ! WLS-SPI metric numbers range from 0000 to 0999. The 0700 to 0799 range is reserved for User Defined Metrics. WLS-SPI metrics can then be identified as BXXX, where XXX represents the number assigned to the metric.
Chapter 1 Metric Specification Description Collection Interval How often the metric is collected and analyzed. (5 min, 15 min, 1 hour, 1 time daily) OVO Min/Max Threshold Because this setting is the same for all WebLogic Server metrics, which have maximum thresholds, it is omitted. Default OVO Threshold Shows the default OVO threshold for metrics with parallele monitor templates. (*=Metrics that should have been assigned a threshold value of 0 are set at 0.
Chapter 1 Metric B001_ServerStat Metric B001_ServerStat Monitor Template Name WLSSPI_0001 Metric Name ServerStat Metric Type Alarming Description Status of a server, monitors whether running or not. WebLogic 6.0/6.1 or Both Both Severity: Condition with threshold Four conditions Critical: WLSSPI-0001.1, threshold 4 Critical: WLSSPI-0001.2, threshold 3 Critical: WLSSPI-0001.3, threshold 2 Warning: WLSSPI-0001.
Chapter 1 Metric B001_ServerStat Monitor Template Name WLSSPI_0001 Instruction Text For each server, this metric will report the status (running, shutdown in progress, shutdown pending, suspended, or unknown). Probable cause: If the server is not in a running state, the following events may have occurred: 1) The WebLogic Administrator has selected 'Shutdown this server' from the Administration console. 2) The WebLogic Administrator has selected 'Suspend this server' from the Administration console.
Chapter 1 Metric B002_ServerStatusRep Metric B002_ServerStatusRep Monitor Template Name N/A—Used in a report generated by HP OpenView Reporter Metric Name Server Status Report Metric Type Reporting Description Status of server—reporting WebLogic 6.0/6.
Chapter 1 Metric B005_JVMMemUtilPct Metric B005_JVMMemUtilPct Monitor Template Name WLSSPI_0005 Metric Name JVM Memory Utilization Percent Metric Type Alarming Description Percentage of heap space used in the JVM. WebLogic 6.0/6.1 or Both Both Severity: Condition Two conditions: Critical: WLSSPI-0005.1, threshold 98 Major: WLSSPI-0005.2, threshold 95 Collection Interval 5m Message Group WebLogic Message Text WLSSPI-0005.
Chapter 1 Metric B005_JVMMemUtilPct Monitor Template Name WLSSPI_0005 Instruction Text The JVM is running out of available heap space. Probable cause: The JVM heap size may be set too low for the client load. Potential impact: The JVM heap size determines how often and how long the VM spends collecting garbage (de-allocating unused Java objects). The Java heap is where the objects of a Java program live.
Chapter 1 Metric B010_ExQueThruRate Metric B010_ExQueThruRate Monitor Template Name N/A—Used for reporting (Reporter) and graphing (Performance) only . Metric Name Execute Queue Throughput Rate Metric Type Reporting, Graphing Description Number of requests serviced by an execute queue per second. WebLogic 6.0/6.
Chapter 1 Metric B011_ExQThrdUtilPct Metric B011_ExQThrdUtilPct Monitor Template Name WLSSPI_0011 Metric Name Execute Queue Thread Utilization Percent Metric Type Alarming Description Percentage of threads in use for a server’s execute queue. WebLogic 6.0/6.1 or Both Both Severity: Condition Three conditions: Critical: WLSSPI-0011.1, threshold 90 Major: WLSSPI-0011.2, threshold 85 Minor: WLSSPI-0011.3, threshold 80 Collection Interval 15m Message Group WebLogic Message Text WLSSPI-0011.
Chapter 1 Metric B011_ExQThrdUtilPct Monitor Template Name WLSSPI_0011 Instruction Text The utilization of the WebLogic server execute threads has exceeded a threshold value. Probable cause: The number of incoming client requests has resulted in all the execute threads being allocated. Potential impact: At 100% utilization, the WebLogic server will not have any threads available to service incoming requests.
Chapter 1 Metric B012_ExQueWaitCnt Metric B012_ExQueWaitCnt Monitor Template Name WLSSPI_0012 Metric Name Execute Queue Wait Count Metric Type Alarming, Graphing Description The number of client requests waiting to be serviced WebLogic 6.0/6.1 or Both Both Severity: Condition Minor: WLSSPI-0012.1, threshold 10 Collection Interval 15m Message Text WLSSPI-0012.
Chapter 1 Metric B013_SocketTrafficRt Metric B013_SocketTrafficRt Monitor Template Name N/A—Used for graphing only. Metric Name Socket Traffic Rate Metric Type Graphing Description Number of connections opened per second. WebLogic 6.0/6.1 or Both Both Severity: Condition N/A Metric Type Graphing only.
Chapter 1 Metric B014_ActiveSocketCnt Metric B014_ActiveSocketCnt Monitor Template Name WLSSPI_0014 Metric Name Active Sockets Count Metric Type Alarming, Graphing. Description Number of socket connections opened. WebLogic 6.0/6.1 or Both Both Severity: Condition Minor: WLSSPI-0014.1, threshold 5 Collection Interval 15m Message Text WLSSPI-0014.
Chapter 1 Metric B220_EJBEntityCacheSize Metric B220_EJBEntityCacheSize Monitor Template Name N/A—Used in a report generated by HP OpenView Reporter Metric Name EJB Entity Cache Size Metric Type Reporting Description Size of entity EJB cache. WebLogic 6.0/6.1 or Both 6.
Chapter 1 Metric B221_EJBMessageDrivenCacheSize Metric B221_EJBMessageDrivenCacheSize Monitor Template Name N/A—Used in a report generated by HP OpenView Reporter Metric Name EJB Message Driven Cache Size Metric Type Reporting WebLogic 6.0/6.1 or Both 6.1 Severity: Condition N/A Description Size of the Message Driven EJB cache.
Chapter 1 Metric B222_EJBStatefulCacheSize Metric B222_EJBStatefulCacheSize Monitor Template Name N/A—Used in a report generated by HP OpenView Reporter Metric Name EJB Stateless Cache Size Metric Type Reporting Description Size of the stateful EJB cache. WebLogic 6.0/6.1 or Both 6.
Chapter 1 Metric B223_EJBStatelessCacheSize Metric B223_EJBStatelessCacheSize Monitor Template Name N/A—Used in a report generated by HP OpenView Reporter Metric Name EJB Stateless Cache Size Metric Type Reporting WebLogic 6.0/6.1 or Both 6.1 Severity: Condition N/A Description Size of the stateless EJB cache.
Chapter 1 Metric B224_EJBStatelessCacheUtilPct Metric B224_EJBStatelessCacheUtilPct Monitor Template Name WLSSPI_0224 Metric Name EJB Stateless Cache Utilization Percent Metric Type Alarming, Reporting Description Percentage of stateless EJB beans in the cache in use WebLogic 6.0/6.1 or Both 6.1 Severity: Condition Warning: WLSSPI-0224.1, threshold 90% Collection Interval 15m Message Group WebLogic Message Text WLSSPI-0224.
Chapter 1 Metric B025_EJBFreePoolWtRt Metric B025_EJBFreePoolWtRt Monitor Template Name WLSSPI_025 Metric Name Aggregate EJB Free Pool Wait Rate Metric Type Alarming, Graphing Description Number of times per minute that no EJB beans were available from the free pool . WebLogic 6.0/6.1 or Both 6.1 Severity: Condition Warning: WLSSPI-0025.1, threshold 10 Collection Interval 15m Message Group WebLogic Message Text WLSSPI-0025.
Chapter 1 Metric B025_EJBFreePoolWtRt Monitor Template Name WLSSPI_025 Instruction Text The number of times per minute no EJBs were available from the free pool has exceeded the threshold value. Probable cause: The max-beans-in-free-pool element may have been set too low, or all instances of an EJB class may be active. Potential impact: New clients requesting an EJB class will be blocked until an active EJB completes a method call.
Chapter 1 Metric B225_EJBFreePoolWtRt Metric B225_EJBFreePoolWtRt Monitor Template Name WLSSPI_0225 Metric Name EJB Free Pool Wait Rate Metric Type Alarming, Reporting WebLogic 6.0/6.1 or Both 6.1 Severity: Condition Warning: WLSSPI-0225.1, threshold 10 Description Number of times/minute no EJB beans were available from the free pool (drill down). Collection Interval 15m Default OVO Threshold 10 Message Group WebLogic Message Text WLSSPI-0025.
Chapter 1 Metric B225_EJBFreePoolWtRt Monitor Template Name WLSSPI_0225 Instruction Text The number of times per minute no EJBs were available from the free pool has exceeded the threshold value. Probable cause: The max-beans-in-free-pool element may have been set too low, or all instances of an EJB class may be active. Potential impact: New clients requesting an EJB class will be blocked until an active EJB completes a method call.
Chapter 1 Metric B026_EJBTimeoutRate Metric B026_EJBTimeoutRate Monitor Template Name WLSSPI_0026 Metric Name EJB Metric Type Alarming, Graphing WebLogic 6.0/6.1 or Both 6.1 Severity: Condition Warning: WLSSPI-0026.1: Threshold 10 Description The number of times per minute a client timed out waiting for an EJB. Collection Interval 15m Default OVO Threshold 10 Message Group WebLogic Message Text WLSSPI-0226.
Chapter 1 Metric B226_EJBTimeoutRate Metric B226_EJBTimeoutRate Monitor Template Name WLSSPI_0226 Metric Name EJB Timeout Rate Metric Type Alarming, Reporting WebLogic 6.0/6.1 or Both 6.1 Severity: Condition One condition: WLSSPI-0226.1: Warning, threshold 10 Description Number of times a client timed out waiting for an EJB bean (drill down). Collection Interval 15m Message Group WebLogic Message Text WLSSPI-0226.
Chapter 1 Metric B227_EJBEntityTranThruRt Metric B227_EJBEntityTranThruRt Monitor Template Name N/A—Used in a report generated by HP OpenView Reporter Metric Name EJB Entity Transaction Throughput Rate Metric Type Reporting WebLogic 6.0/6.1 or Both 6.1 Severity: Condition N/A Description Number of entity EJB transactions per second (drill down).
Chapter 1 Metric B228_EJBMessageDrivenTranThruRt Metric B228_EJBMessageDrivenTranThruRt Monitor Template Name N/A—Used in a report generated by HP OpenView Reporter Metric Name EJB Message Driven Transaction Throughput Rate Metric Type Reporting Description Number of MessageDriven EJB transactions per second (drill down). WebLogic 6.0/6.1 or Both 6.
Chapter 1 Metric B229_EJBStatefulTranThruRt Metric B229_EJBStatefulTranThruRt Monitor Template Name N/A—Used in a report generated by HP OpenView Reporter Metric Name EJB Stateful Transaction Throughput Rate Metric Type Reporting Description Number of Stateful EJB transactions per second (drill down). WebLogic 6.0/6.1 or Both 6.
Chapter 1 Metric B230_EJBStatelessTranThruRt Metric B230_EJBStatelessTranThruRt Monitor Template Name N/A—Used in a report generated by HP OpenView Reporter Metric Name EJB Stateless Transation Throughput Rate Metric Type Reporting WebLogic 6.0/6.1 or Both 6.1 Severity: Condition N/A Description Number of Stateless EJB transactions per second (drill down).
Chapter 1 Metric B231_EJBEntityTranRbRt Metric B231_EJBEntityTranRbRt Monitor Template Name N/A—Used in a report generated by HP OpenView Reporter Metric Name EJB Entity Transaction Rollback Rate Metric Type Reporting Description Number of Entity EJB transactions rolled back per second (drill down). WebLogic 6.0/6.1 or Both 6.
Chapter 1 Metric B232_EJBMessageDrivenTranRbRt Metric B232_EJBMessageDrivenTranRbRt Monitor Template Name N/A—Used in a report generated by HP OpenView Reporter Metric Name EJB Message Driven Transaction Rollback Rate Metric Type Reporting WebLogic 6.0/6.1 or Both 6.1 Description Number of MessageDriven EJB transactions rolled back per second (drill down).
Chapter 1 Metric B233_EJBStatefulTranRbRt Metric B233_EJBStatefulTranRbRt Monitor Template Name N/A—Used in a report generated by HP OpenView Reporter Metric Name EJB Stateful Transaction Rollback Rate Metric Type Reporting WebLogic 6.0/6.1 or Both 6.1 Description Number of Stateful EJB transactions rolled back per second (drill down).
Chapter 1 Metric B234_EJBStatelessTranRbRt Metric B234_EJBStatelessTranRbRt Monitor Template Name N/A—Used in a report generated by HP OpenView Reporter Metric Name EJB Stateless Transaction Rollback Rate Metric Type Reporting WebLogic 6.0/6.1 or Both 6.1 Description Number of Stateless EJB transactions rolled back per second (drill down).
Chapter 1 Metric B035_EJBTranThruRt Metric B035_EJBTranThruRt Monitor Template Name WLSSPI_0035 Metric Name EJB Transaction Throughput Rate Metric Type Alarming, Reporting, Graphing WebLogic 6.0/6.1 or Both 6.1 Severity: Condition Warning: WLSSPI-0035.1, threshold, 10000 Description Number of EJB transactions per second. Collection Interval 15m Message Group WebLogic Message Text WLSSPI-0035.
Chapter 1 Metric B036_EJBTranRbRt Metric B036_EJBTranRbRt Monitor Template Name WLSSPI_0036 Metric Name EJB Transaction Rollback Rate Metric Type Alarming, Reporting, Graphing Description Number of EJB transactions rolled back per second WebLogic 6.0/6.1 or Both 6.1 Severity: Condition Warning: WLSSPI-0036.1,threshold 1 Collection Interval 15m Message Group WebLogic Message Text WLSSPI-0036.
Chapter 1 Metric B240_ServletAveExecTime Metric B240_ServletAveExecTime Monitor Template Name 240 Metric Name Servelet Average Execution Time Metric Type Alarming, Reporting WebLogic 6.0/6.1 or Both Both Severity: Condition Warning: WLSSPI-0240.1, threshold 1000 Description Average execution time for a servlet in milliseconds. Collection Interval 1h Message Group WebLogic Message Text WLSSPI-0240.1: Ave.
Chapter 1 Metric B242_ServletReqRate Metric B242_ServletReqRate Monitor Template Name WLSSPI_0242 Metric Name Servlet Request Rate Metric Type Alarming, Reporting Description Number of requests for a servlet per second WebLogic 6.0/6.1 or Both Both Severity: Condition Warning: WLSSPI-0242.1, threshold 10000 Collection Interval 1h Message Group WebLogic Message Text WLSSPI-0242.
Chapter 1 Metric B245_WebAppSessionCnt Metric B245_WebAppSessionCnt Monitor Template Name WLSSPI_0245 Metric Name Web Application Session Count Metric Type Alarming, Reporting Description Number of open sessions for a Web application. WebLogic 6.0/6.1 or Both Both Severity: Condition Warning: WLSSPI-0245.1, threshold 100 Collection Interval 5min Message Group WebLogic Message Text WLSSPI-0245.
Chapter 1 Metric B246_WebAppHitRt Metric B246_WebAppHitRt Monitor Template Name N/A—Used in a report generated by HP OpenView Reporter Metric Name Web Application Hit Rate Metric Type Reporting Description Number of open sessions for a Web application per second. WebLogic 6.0/6.
Chapter 1 Metric B251_JMSServerUtilMessageCnt Metric B251_JMSServerUtilMessageCnt Monitor Template Name WLSSPI_0251 Metric Name JMS Server Utilization Message Percent Metric Type Alarming Description Percentage of the JMS server filled, based on the number of messages. WebLogic 6.0/6.1 or Both Both Severity: Condition Two conditions: Critical: WLSSPI-0251.1, threshold, 98% Major: WLSSPI-0251.2 , threshold 95% Collection Interval 15m Message Group WebLogic Message Text WLSSPI-0251.
Chapter 1 Metric B252_JMSServerUtilByteCnt Metric B252_JMSServerUtilByteCnt Monitor Template Name WLSSPI_0252 Metric Name JMS Server Utilization Byte Count Metric Type Alarming, Reporting Description Percentage the JMS server filled, based on total bytes. WebLogic 6.0/6.1 or Both Both Severity: Condition Two conditions: Critical: WLSSPI-0252.1, threshold, 98% Major: WLSSPI-0252.2 , threshold 95% Collection Interval 15m Message Group WebLogic Message Text WLSSPI-0252.
Chapter 1 Metric B253_JMSServerMessageByteCnt Metric B253_JMSServerMessageByteCnt Monitor Template Name WLSSPI_253 Metric Name JMS Queue Threshold Percent by Message Percent Metric Type Alarming, Reporting Description Percentage of time the server threshold condition was satisfied, based on the number of messages. WebLogic 6.0/6.1 or Both Both Severity: Condition Warning: WLSSPI-0253.1, threshold 10% Collection Interval 15m Message Group WebLogic Message Text WLSSPI-0253.
Chapter 1 Metric B254_JMSServerThreshByteCnt Metric B254_JMSServerThreshByteCnt Monitor Template Name WLSSPI_0254 Metric Name JMS Server Threshold Byte Percent Metric Type Alarming, Reporting Description Percentage of time server threshold condition was satisfied, based on total bytes. WebLogic 6.0/6.1 or Both Both Severity: Condition Warning: WLSSPI-0254., threshold, 10% Collection Interval 15m Message Group WebLogic Message Text WLSSPI-0254.
Chapter 1 Metric B255_JMSServerThruMessageCnt Metric B255_JMSServerThruMessageCnt Monitor Template Name N/A—Used in a report generated by HP OpenView Reporter Metric Name JMS Server Throughput Message Rate Metric Type Reporting Description Number of messages passed through the JMS server per second. WebLogic 6.0/6.
Chapter 1 Metric B256_JMSServerThruByteCnt Metric B256_JMSServerThruByteCnt Monitor Template Name N/A—Used in a report generated by HP OpenView Reporter Metric Name JMS Server Throughput Byte Rate Metric Type Reporting Description Number of bytes passed through the JMS server per second. WebLogic 6.0/6.
Chapter 1 Metric B260_JDBCConnectionPoolUtil Metric B260_JDBCConnectionPoolUtil Monitor Template Name WLSSPI_0260 Metric Name JDBC Connection Pool Utilization Percent Metric Type Alarming, Reporting Description Percentage utilization of available JDBC connections in connection pool. WebLogic 6.0/6.1 or Both Both Severity: Condition Two conditions: Critical: WLSSPI-0260.1, threshold, 98% Major: WLSSPI-0260.
Chapter 1 Metric B061_JDBCConPlWtCnt Metric B061_JDBCConPlWtCnt Monitor Template Name WLSSPI_0061 Metric Name JDBC Connect Pool Wait Count Metric Type Alarming, Graphing Description Number of clients waiting for a connection from connection pools. WebLogic 6.0/6.1 or Both Both Severity: Condition Warning: WLSSPI-0061.1, threshold, 10 Collection Interval 5m Message Group WebLogic Message Text WLSSPI-0061.
Chapter 1 Metric B262_JDBCConnectionPoolThruRt Metric B262_JDBCConnectionPoolThruRt Monitor Template Name N/A—Used in a report generated by HP OpenView Reporter Metric Name JDBC Connection Pool Throughput Rate Metric Type Reporting Description Number of clients serviced by connection pool per second. WebLogic 6.0/6.
Chapter 1 Metric B070_TranAveTime Metric B070_TranAveTime Monitor Template Name WLSSPI_0070 Metric Name Transaction Average Time Metric Type Alarming, Reporting, Graphing Description Average Commit time for transactions. WebLogic 6.0/6.1 or Both Both Severity: Condition Minor: WLSSPI-0070.1, threshold, 100 msec Collection Interval 5m Message Group WebLogic Message Text WLSSPI-0070.1: Ave.
Chapter 1 Metric B071_TranRollbackPct Metric B071_TranRollbackPct Monitor Template Name WLSSPI_0071 Metric Name Transactions Rollback Percent Metric Type Alarming, Reporting, Graphing Description Percentage of transactions rolled back , based on the total. WebLogic 6.0/6.1 or Both Both Severity: Condition Minor: WLSSPI-0071.1; threshold, 1 Collection Interval 5m Message Group WebLogic Message Text WLSSPI-0071.
Chapter 1 Metric B071_TranRollbackPct Monitor Template Name WLSSPI_0071 Instruction Text The percentage of transactions rolled back has exceeded the threshold value. Probable cause: Application design issues or resource issues. Potential impact: User requests are not being successfully completed. Suggest action: The WebLogic administrator should check the necessary database systems and ensure they are functioning correctly.
Chapter 1 Metric B072_TranResErrRbPct Metric B072_TranResErrRbPct Monitor Template Name WLSSPI_0072 Metric Name Transaction Resource Error Rollback Percent Metric Type Alarming, Reporting, Graphing Description Percentage of the transactions rolled back due to resource error. WebLogic 6.0/6.1 or Both Both Severity: Condition Minor: WLSSPI-0072.1; threshold, 1 Collection Interval 5m Message Group WebLogic Message Text WLSSPI-0072.
Chapter 1 Metric B073_TranAppErrRbPct Metric B073_TranAppErrRbPct Monitor Template Name WLSSPI_0073 Metric Name Transaction Application Error Rollback Percent Metric Type Alarming, Reporting, Graphing Description Percentage of transactions rolled back due to resource error. WebLogic 6.0/6.1 or Both Both Severity: Condition Minor: WLSSPI-0073.1, threshold, 1 Collection Interval 5m Message Group WebLogic Message Text WLSSPI-0073.
Chapter 1 Metric B074_TranTimErrRbPct Metric B074_TranTimErrRbPct Monitor Template Name WLSSPI_0074 Metric Name Transaction Time Error Rollback Percent Metric Type Alarming, Reporting, Graphing Description Percentage of transactions rolled back due to a timeout error. WebLogic 6.0/6.1 or Both Both Severity: Condition Minor: WLSSPI-0074.1, threshold, 1 Collection Interval 5m Message Group WebLogic Message Text WLSSPI-0074.
Chapter 1 Metric B075_TranSysErrRbPct Metric B075_TranSysErrRbPct Monitor Template Name WLSSPI_0075 Metric Name Transaction System Error Rollback Percent Metric Type Alarming, Reporting, Graphing Description Percentage of the transactions rolled back, based on system error. WebLogic 6.0/6.1 or Both Both Severity: Condition Minor: WLSSPI-0075.1, threshold, 1 Collection Interval 5m Message Group WebLogic Message Text WLSSPI-0075.
Chapter 1 Metric B076_TranThruRate Metric B076_TranThruRate Monitor Template Name N/A—Used for HP OpenView Reporter reports and Performance Graphs only Metric Name Transaction Throughput Rate Metric Type Graphing, Reporting Description Number of transactions processsed per second.. WebLogic 6.0/6.
Chapter 1 Metric B077_TranHeurCnt Metric B077_TranHeurCnt Monitor Template Name WLSSPI_0077 Metric Name Transaction Heuristic Count Metric Type Alarming, Reporting, Graphing Description Percentage of transactions returning a heuristic decision. WebLogic 6.0/6.1 or Both Both Severity: Condition Minor: WLSSPI-0075.1, threshold 1 Collection Interval 5m Message Group WebLogic Message Text WLSSPI-0077.
Chapter 1 Metric B077_TranHeurCnt Monitor Template Name WLSSPI_0077 Instruction text (contd.) HeuristicCommit - one resource participating in a transaction decided to autonomously commit its work, even though it agreed to prepare itself and wait for a commit decision. If the Transaction Manager decided to rollback the transaction, the resource's heuristic commit decision was incorrect, and might lead to an inconsistent outcome since other branches of the transaction were rolled back.
Chapter 1 Metric B080_ClsOutMesFailRt Metric B080_ClsOutMesFailRt Monitor Template Name WLSSPI_0080 Metric Name Cluster Outgoing Message Failure Rate Metric Type Alarming, Graphing Description Number of multicast messages per minute to cluster re-sent. WebLogic 6.0/6.1 or Both Both Severity: Condition Minor: WLSSPI-0080.1, threshold 1 Collection Interval 5m Message Group WebLogic Message Text WLSSPI-0080.
Chapter 1 Metric B080_ClsOutMesFailRt Monitor Template Name WLSSPI_0080 Instruction Text (contd.) If you choose to distribute a cluster over a WAN (or across multiple subnets), you must plan and configure your network topology to ensure that multicast messages are reliably transmitted to all servers in the cluster. Specifically, your network must meet the following requirements: 1) The network must fully support IP multicast packet propagation.
Chapter 1 Metric B081_ClsInMesFailRt Metric B081_ClsInMesFailRt Monitor Template Name WLSSPI_0081 Metric Name Cluster Incoming Message Failure Rate Metric Type Alarming, Graphing Description Number of multicast messages per minute from cluster lost by server. WebLogic 6.0/6.1 or Both Both Severity: Condition Minor: WLSSPI-0081.1, threshold 1 Collection Interval 5m Message Group WebLogic Message Text WLSSPI-0081.
Chapter 1 Metric B081_ClsInMesFailRt Monitor Template Name WLSSPI_0081 Instruction Text (contd.) If you choose to distribute a cluster over a WAN (or across multiple subnets), you must plan and configure your network topology to ensure that multicast messages are reliably transmitted to all servers in the cluster. Specifically, your network must meet the following requirements: 1) The network must fully support IP multicast packet propagation.
Chapter 1 Metric B085_InvLoginAttCnt Metric B085_InvLoginAttCnt Monitor Template Name WLSSPI_0085 Metric Name Invalid Login Attempts Count Metric Type Alarming, Graphing Description Number of invalid login attempts. WebLogic 6.0/6.1 or Both Both Severity: Condition Minor: WLSSPI-0085.1, threshold 2 Collection Interval 5m Message Group WebLogic Message Text WLSSPI-0085.
Chapter 1 Metric B090_TimeSerExcepCnt Metric B090_TimeSerExcepCnt Monitor Template Name WLSSPI_0090 Metric Name Time Services Exception Count Metric Type Alarming Description Number of exceptions thrown for all triggers. WebLogic 6.0/6.1 or Both Both Severity: Condition Minor: WLSSPI-0090.1 , threshold 1 Collection Interval 5m Message Group WebLogic Message Text WLSSPI-0090.
Chapter 1 Metric B091_TimeSerThruRt Metric B091_TimeSerThruRt Monitor Template Name WLSSPI_0091 Metric Name Time Services Throughput Rate Metric Type Graphing Description Number of triggers executed per second. WebLogic 6.0/6.1 or Both Both Severity: Condition N/A Collection Interval 5m Message Group N/A Message Text N/A Instruction Text N/An.
Chapter 1 Metric B091_TimeSerThruRt 1 - 72
2 WebLogic Server SPI Log File and Configuration File Templates
Chapter 2 This section shows the WebLogic Server SPI templates that monitor logged information and modifications occurring in both the WebLogic Server and WebLogic Server SPI files. These templates detect error messages internal to WebLogic SPI, as well as changes made to the WebLogic Server XML configuration files.
Chapter 2 WLSSPI-Error Log WLSSPI-Error Log Description Monitors the WebLogic SPI error log and captures critical errors, which it sends to the Message Browser. Severity Critical Message Group WLSSPI Help Text Available for each error as detected: WASSPI-1 through WASSPI-226. See the HP OpenView SMART Plug-In for WebLogic Server User’s Guide, Chapter 6, for detailed Help text for each error with a WASSPI prefix. Each error’s Help text is covered in Chapter 6.
Chapter 2 WebLogic Config Files WebLogic Config Files Description Detects changes in the WebLogic xml configuration file. Severity Warning Message Group WebLogic Help Text One of the Weblogic Server properties files has been saved. Very likely, the file contents has changed. The name of the updated configuration file is listed in field 'Object' of this VPO message. Probable Cause(S): Re-configuration of the WebLogic Server.
Chapter 2 WebLogic Log Template WebLogic Log Template Description Catches critical errors and warnings in the WebLogic Server log file. Severity Critical Warning Message Group WebLogic Help Text Probable Cause: A message with the indicator 'Emergency' or 'Critical' was detected in the WebLogic Server logfile. OR A message with the indicator 'Notice,' 'Error' or 'Alert' was detected in the WebLogic Server logfile.
Chapter 2 WebLogic Log Template 2-6
Index A A, key for Metric Type column 1-8 area (in metric column), description of 1-9 availability metrics B001_ServerStat 1-10 B002_ServerStatusRep 1-12 C cluster metrics B080_ClsOutMesFailRt 1-65 B081_ClsInMesFailRt 1-67 collection interval, description of 1-9 condition as used in metric monitor templates, description of 1-8 B224_EJBStatelessCacheUtilPct 1-25 B226_EJBTimeoutRate (drill down) 1-31 B227_EJBEntityTranThruRt (drill down) 1-32 B228_EJBMessageDrivenTranThruRt (drill down) 1-33 B229_EJBStatef
B253_JMSServerMessageByteCnt 1-48 B254_JMSServerThreshByteCnt 1-49 B255_JMSServerThruMessageCnt 1-50 B256_JMSServerThruByteCnt 1-51 JDBC metrics B061_JDBCConPlWtCnt 1-53 B260_JDBCConnectionPoolUtil 1-52 B262_JDBCConnectionPoolThruRt 1-54 B014_ActiveSocketCnt 1-20 R R, key for Metric Type column 1-8 Reporter metrics B002_ServerStatusRep 1-12 S L logfiles WLSSPI-Error Log, specifications of 2-3 M message group, description of 1-9 message text, description of 1-9 Metric 1-8 metric area, description of 1-9
WebLogic Config File template, specifications of 2-4 WebLogic Log Template, specifications of 2-5 WLSSPI-Error Log, specifications of 2-3 iii