Performance Analysis Tools for HP-UX 11i on Integrity Servers Printed in the US HP Part Number: 5991-7469 Published: 6 November 2006 Edition: 1.
Table of Contents 1 Who is this whitepaper for?.....................................................................................................................5 2 What tools are discussed?........................................................................................................................5 3 HP Caliper: Free tool for improving application or system performance.....................................................6 4 Standard HP-UX commands for obtaining system performance data........
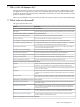
1 Who is this whitepaper for? This paper is written for HP-UX users interested in improving the performance of HP Integrity systems and applications running on those systems. It recommends supported tools available from HP to help troubleshoot performance problems and provides links to where the tools can be obtained. It also provides pointers to reference materials. It does not provide details on how to use the tools and does not discuss steps to perform in troubleshooting.
HP Tool Description HP-UX Workload Manager (WLM) Provides automatic resource allocation and application performance management through the use of prioritized service-level objectives (SLOs). HP Process Resource Manager (PRM) Tool used to control the amount of resources that processes use during peak system load. All the tools are supported on HP Integrity servers running HP-UX 11i v2.
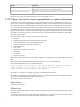
Example of use This command runs the default measurement, for a sampled call graph, on an application named myprog: $ caliper myprog See also “HP OpenView GlancePlus” (page 12) For more information See the HP Caliper Web site at: http://www.hp.com/go/caliper 4 Standard HP-UX commands for obtaining system performance data The commands described are all available on any HP-UX system. 4.1 fsadm (file system administration) This command performs selected administration tasks on file systems.
When to use When you need information on shared memory, message queues, or semaphores. Example of use To get message queue information: $ ipcs -qa For more information See man ipcs. 4.4 kcweb (kernel configuration Web tool) The kcweb application is a combination of a command set and a Web-based graphical user interface (GUI) that perform HP-UX kernel configuration.
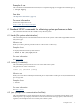
4.6 nettl (network tracing and logging) This command is used to control the network tracing and logging facility. Logging is a means of capturing network activities such as state changes, errors, and connection establishment. Tracing is used to capture or take a snapshot of inbound and outbound packets going through the network, as well as loopback or header information. The general form of this command is: netstat -option When to use When you want to capture network events or packets.
For more information See man swapinfo. 4.9 top (top system processes) This command displays the top processes on the system and periodically updates the information. Raw CPU percentage is used to rank the processes. This command provides system CPU metric summaries and process-level summaries. It samples on specified internals (the default is 5 seconds). It uses the pstat interface to extract metrics from the kernel. When to use To get a general picture about the processes that are using the CPU.
5.2 HPjtune HPjtune is a Java Garbage Collection (GC) visualization tool for analyzing garbage collection activity in a Java program. The analysis is carried out off-line or online, based on the output of the JVM by means of the -Xverbosegc output file, which you collect by running the application on HP-UX. The syntax is: -Xverbosegc[:help]|[0|1][:file=[stdout|stderr|filename]] You can also use the -Xloggc output file, though this file does not provide as much information as -Xverbosegc.
6.1 HP OpenView GlancePlus Pak This product is the combination of two products, each of which is also sold separately. The products are: • HP OpenView GlancePlus • HP OpenView Performance Agent (OVPA) See the paper “Making your HP GlancePlus Pak perform” for information about how you can use GlancePlus Pak for performance purposes. The two products are described below. 6.1.1 HP OpenView GlancePlus GlancePlus is a system-monitoring and diagnostic tool for real-time performance information.
http://www.openview.hp.com/products/ovperf 6.2 HP OpenView Performance Manager The HP OpenView Performance Manager is a graphical analysis and planning tool you can use to analyze and project future resource utilization and performance trends. Using historical data, the Performance Manager lets you examine resource utilization and performance trends in-depth. With this information, you can then uncover bottlenecks that, if left unchecked, result in poor service levels.
8 Performance troubleshooting resources • • • • • • HP-UX 11i Tuning and Performance by Robert F. Sauers, Chris P. Ruemmler, Peter S.