
STREAMS/UX for the HP 9000 Reference Manual

196
Debugging STREAMS/UX Modules and Drivers
Debugging Examples
Debugging Examples
Example 1
The following core dump was obtained while using a modified version of the
sp driver, which is described in example #2 in the strdb section of this
chapter.
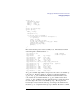
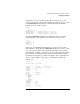
On entry to adb, we first look at the msgbuf to look for the panic message
and hex stack trace. The interesting portion of msgbuf for this dump is:
msgbuf+10/s
.
.
.
interrupt type 15, pcsq.pcoq = 0.3b2cc, isr.ior = 0.0
Data page fault on interrupt stack
B2352A HP-UX () #1: Fri Aug 14 00:49:59 PDT 1992
panic: (display==0xbf00, flags==0x0) Interrupt
PC-Offset Stack Trace (read across, most recent is 1st):
0x0013e81c 0x000cddb8 0x000bc93c 0x0003b2cc 0x0012e2bc
0x0016b350
End Of Stack
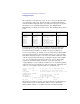
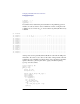
First we translate the hex stack trace in the panic message into procedure
names and addresses. Using the adb i command for each of the hex
addresses in the panic message stack trace, we get the following symbolic
stack trace:
panic+40: addil 800,dp
interrupt+7E8: rsm 1,r0
$ihndlr_rtn: rsm 1,r0
sp_timeout+2C: ldws 0(arg3),arg2
softclock+94: b,n softclock+30
external_interrupt+350: ldil 261000,r22
The address where the illegal data access occurred is sp_timeout+2C. The
isr.ior in the panic message indicates that the data address that caused the
panic is 0.0, and the instruction at sp_timeout+2C is ldws 0(arg3),arg2, so
arg3 must have been 0 at the time of the panic. So we are probably
dereferencing a null pointer. Our first task is to find out which pointer this is.
To do this we need to know which source code line sp_timeout+2C
corresponds to. Here is the source code for sp_timeout():