
STREAMS/UX for the HP 9000 Reference Manual

184
Debugging STREAMS/UX Modules and Drivers
Using adb
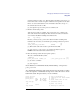
[2] Save state structure + 0x84 is the location of the pcogh.
[3] adb's response -- 96B70 is the return instruction address.
[4] Save state structure + 0x78 is the location of the sp.
[5] adb's response -- 7FFE6B98 is the current stack pointer.
[6] Reset sp to the correct value.
[7] Continue to iterate the four basic stack back-tracing steps.
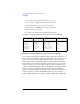
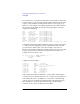
The table of results from the back-tracing so far should look like this:
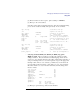
Mapping Assembly Language Locations to Source Code Lines
Once you know the instruction address location where the system panic or
trap occurred, the troubleshooting step is to find where in the source code the
panic or trap occurred. For panics, search the source code for the panic
which uses the same string that was printed out when the kernel panicked.
This will tell you exactly where the panic occurred in the source code. The
method for traps is to use adb to print out the procedure in which the trap
occurred in assembly language. Then, work backwards from the instruction
address, looking for clues in the assembly instructions which will help
pinpoint the corresponding location in the source. The most useful clue is a
branch to another procedure. In PA-RISC, branches are done with the
branch and link instruction, bl, and in assembly a branch will look like this:
sp pcoqh Procedure Address Frame Size
20F380
20F350
20F2D0
7FFE6F48
7FFE6EC8
7FFE6DC8
7FFE6B98
24B34
0xDBF48
0xDB938
1518A4
0xDF108
0xD0BD4
96B70
doadump+0xEC
panic_boot+354
boot+24
panic+0xF0
trap+0xA28
$call_trap+20
qenable+10
0x30
0x80
0x80
0x80
0x100
0x80