
STREAMS/UX for the HP 9000 Reference Manual

183
Debugging STREAMS/UX Modules and Drivers
Using adb
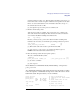
[2] These two lines are adb's response. panic's actual sp is 7FFE6F48.
[3] Reset sp to the correct address.
Now that you have panic's real stack pointer, the other steps in the back-tracing
process can be executed normally. Text preceded by “#” are comments.
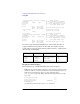
• $call_trap, $call_int, $ihndlr_rtn, $thndlr_rtn, $RDB_trap_patch,
$RDB_int_patch: These procedures do not follow the ordinary procedure
calling conventions. They are written in assembly language, and are used to
create a save state structure which saves the values of all registers at the time of
a trap or an interrupt. The save state is then passed to trap() or the appropriate
interrupt routine. The save state starts at sp - 0x230, and you can retrieve the
previous stack pointer and current pcogh from the save state, as shown below.
The offsets into the save state are for the 10.0 release, and may change from
release to release.
<sp-0x230>sp [1]
<sp+0x84/X [2]
7FFE6C1C: 96B70 [3]
<sp+0x78/X [4]
7FFE6C10: 7FFE6B98 [5]
7FFE6B98>sp [6]
96B70/i [7]
qenable+10: ldws 0(r20),r21
qenable/3i
qenable:
qenable: stw rp,-14(sp)
ldo 80(sp),sp
stw arg0,-0xA4(sp)
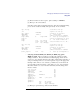
[1] Reset sp to point to the top of the save state structure.
<sp-0x80>sp # calculate new sp
.=X # print out new sp
7FFE6EC8
<sp-0x14/X # find rp in caller's
7FFE6EB4: 0xDF108 # stack frame
0xDF108/i # what instruction address
trap+0xA28: b trap+0xF18 # does rp correspond to?
trap/3i # Look at beginning of trap
trap: # for stack frame size
trap: stw rp,-14(sp)
stwm r3,100(sp) # stack frame size is 0x100
stw r4,-0xFC(sp)
<sp-0x100>sp # calculate new sp
.=X # print out new sp
7FFE6DC8
<sp-0x14/X # find rp in caller's
7FFE6DB4: 0xD0BD4 # stack frame
0xD0BD4/i # what instruction address
$call_trap+20: rsm 1,r0 # does rp correspond to?