
STREAMS/UX for the HP 9000 Reference Manual

182
Debugging STREAMS/UX Modules and Drivers
Using adb
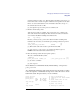
crash_monarch_stack+16C: 0xDB938 # stack frame
0xDB938/i # what instruction address
boot+24: addil 0,dp # does rp correspond to?
boot/3i # look at beginning of boot
boot: # for stack frame size
boot: stw rp,-14(sp)
stwm r3,80(sp) # stack frame size is 0x80
stw r4,-7C(sp)
<sp-0x80>sp # calculate new sp
.=X # print out new sp
20F250
<sp-0x14/X # find rp in caller's
crash_monarch_stack+0xEC: 1518A4 # stack frame
1518A4/i # what instruction address
panic+0xF0: ldw -94(sp),rp # does rp correspond to?
panic/3i # look at beginning of panic
panic: # for stack frame size
panic: stw rp,-14(sp)
stwm r3,80(sp) # stack frame size is 0x80
stw r4,-7C(sp)
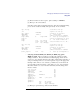
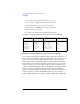
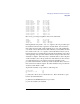
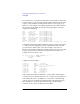
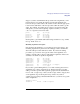
If you are doing a manual stack back-trace in order to find out values of
registers which have been pushed onto the stack, it is useful to save the
results of the four steps at each iteration for future reference. A table such as
the following can be helpful:
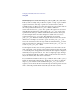
Exceptions to the Four Steps
The four basic steps of stack back-tracing have some exceptions:
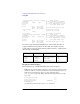
• panic: If your procedure address is in panic, you need to take special steps to find
out the true value of your current stack pointer. Instead of being the previous sp
minus the previous frame size, panic's sp can be found at location
panic_save_state. Do the following to find the value using adb and reset adb's
copy of sp:
panic_save_state/X [1]
panic_save_state: [2]
panic_save_state: 7FFE6F48
7FFE6F48>sp [3]
[1] Ask adb to print out location panic_save_state in hex.
sp pcoqh Procedure Address Frame Size
20F380
20F350
20F2D0
20F250
24B34
0xDBF48
0xDB938
1518A4
doadump+0xEC
panic_boot+354
boot+24
panic+0xF0
0x30
0x80
0x80
0x80