
STREAMS/UX for the HP 9000 Reference Manual

180
Debugging STREAMS/UX Modules and Drivers
Using adb
Basic Stack Back-Tracing
Given the stack pointer, sp, and the current instruction address, pcoqh, it is
possible to get the previous stack pointer and instruction address. The
starting values for sp and pcoqh are obtained from the adb $r command. As
mentioned above, when adb is invoked on a system core with the -k option,
it sets these registers to the values of the machine registers at the time the
system core dump was taken. The $r command prints out these registers.
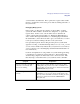
Below are the first few lines of the $r display.
pcsqh 0 pcoqh 24B34 doadump+0xEC
pcsqt 0 pcoqt 0 _fp_status
rp 0xDBF48 panic_boot+354
arg0 1 arg1 0xC57B arg2 2000 arg3
9BD70152
sp 20F380 ret0 303847 ret1 797 dp 1F6000
There are four steps to back-tracing a stack:
1 Determine the size of the current stack frame.
The size of the current stack frame is simply the amount the sp is incremented at
the entry to the current procedure. To find that number, use adb to print out the
first few instructions of the current procedure. To determine the initial current
procedure, look at the value of the register pcoqh, which appears at the end of
the first line of the $r output. In most cases, this initial procedure will be
doadump.
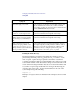
doadump/3i
doadump+3: stw rp,-14(sp)
ldo 30(sp),sp
mfctl iva,r22
doadump's second instruction is an ldo which increments the stack pointer by
0x30, so doadump's stack frame size is 0x30.
2 Determine the previous stack pointer.
The previous stack pointer is the current stack pointer, minus the current stack
frame size. adb can be used to keep track of the sp register by calculating the
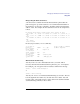
previous stack pointer using the following adb commands:
<sp-0x30>sp [1]
.=X [2]
20F350 [3]
[1] Take the current value of the sp register, decrement it by 0x30, and store the
result back into the sp register. See adb documentation for more information on
adb registers and the “<“ and “>” operators.