
STREAMS/UX for the HP 9000 Reference Manual

177
Debugging STREAMS/UX Modules and Drivers
Using adb
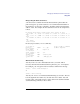
Interpreting the Panic Stack Trace
adb can be used to translate the hexadecimal stack trace printed after the
panic message into procedure addresses. For each hexadecimal number in
the stack trace, use the adb i command to determine where in the kernel the
address occurs. For example, the hex stack trace below can be deciphered as
follows:
PC-Offset Stack Trace (read across, most recent is 1st):
0x0016da70 0x000e5a68 0x000d34cc 0x0009ea14 0x00099714 0x0009
2fdc
0x0006e0c8 0x0006dbb8 0x0006d2a8 0x001954e8 0x00194fa4 0x000b
7e24
0x001846d4 0x00181730 0x00156538 0x00156af8 0x001567b8 0x000e
6d80
0x000d3aac
End Of Stack
In adb (text preceded by “#” are comments):
0x0016da70/i # use of adb i command
panic+30: addil -1000,dp # adb's response
0x000e5a68/i
trap+0xADC: b trap+1004
0x000d34cc/i
$call_trap+20: rsm 1,r0
0x0009ea14/i
flushq+60: ldbs 0xD(r21),r22
0x00099714/i
q_free+1C: ldw -0xA4(sp),r31
Manual Stack Back-Tracing
You may need to use adb to manually back-trace your stack. This is
necessary when the hexadecimal stack trace printed by panic is incomplete.
For example, panic may print a few hex addresses and then the message:
stktrc: cannot find descriptor
or
stktrc: cannot find rp
You may also need to do a manual stack back-tracing if you wish to find out
how the arguments the routines in your stack trace were called. You will
need the value of the stack pointer for each routine in the stack and manual
stack back-tracing will tell you these values.