
STREAMS/UX for the HP 9000 Reference Manual

176
Debugging STREAMS/UX Modules and Drivers
Using adb
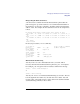
Finding the Panic Message
The kernel maintains a circular message buffer into which text can be
printed using the kernel printf, msg_printf, and cmn_err routines. At the
time of a panic, a panic message is printed to this buffer. A stack trace
consisting of instruction addresses in hexadecimal is also printed out, as well
as the current instruction and data addresses being accessed at the time of the
crash. Other interesting information may also be located in the buffer, such
as system boot-up messages and kernel error messages that may help pin
down the cause of the panic. To print out this buffer, invoke adb on the
system dump and type the following:
msgbuf+10/s
Examples of msgbuf contents are included in the examples at the end of this
chapter.
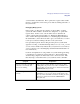
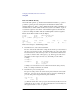
You cannot ping your system. Your system may not be hung, its networking software state
may be deadlocked in some way. If you have a terminal
session that is working, use strdb and adb to look at the kernel
and the STREAMS/UX subsystem state.
Carriage returns do not echo on the
console or on other login sessions.
Your system is hung, but is probably TOC-able. TOC the
system and examine the kernel globals in the dump.
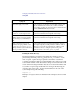
Your system has an LED activity
display which is not being updated;
it is showing no system activity at
all.
Your system is hung, but is probably TOC-able. TOC the
system and examine the kernel globals in the dump.
Your system has an access port
enabled, and typing CTRL-b on the
console gives no response, or you
attempt to TOC a system without an
access port with no success.
Your system is ignoring very high-level interrupts, and it is so
thoroughly hung that you will probably be unable to TOC it.
Hangs as severe as this are extremely rare. Hit the system
reset button, and try to debug the problem using other
methods such as code reviews, panics, or printfs.
Symptom Explanation