
STREAMS/UX for the HP 9000 Reference Manual


168
Debugging STREAMS/UX Modules and Drivers
HP-UX Kernel Debugging Tools and strdb
HP-UX Kernel Debugging Tools and strdb
The strdb tool can be used in conjunction with other standard HP-UX kernel
debugging tools to provide STREAMS/UX-specific information and data
formatting. Generally, if your system is running normally except for
STREAMS/UX, it is recommended that you use strdb to debug the problem.
If your system panics or hangs, strdb can be used on the resulting system
core dump, along with adb to diagnose the problem. strdb is documented
earlier in this chapter, and examples of using adb and strdb together are
given at the end of this chapter.
What Is a System Panic?
Unlike user code, programming errors in kernel code can cause system
panics. A system panic will result in a panic message to the console. Also,
a system core dump will be generated. This is a copy of physical memory at
the time of the panic. The panic message and core dump can be examined
using adb and strdb to determine the cause of the panic.
There are three main categories of panics. The first category is when a
kernel routine calls panic() because of a system inconsistency from which it
cannot recover. In this case, the panic message contains a string from the
routine that called panic(), explaining why panic was called. In the example
below, the panic string is “ifree: freeing free inode.” A hexadecimal stack
trace will also be printed. Interpreting the stack trace will be described later.
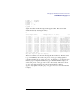
System Panic:
@(#)9245XA HP-UX (A.10.00) #1: Wed Sep 28 15:47:13 PDT 1994
panic: (display==0xb000, flags==0x0) ifree: freeing free inode
PC-Offset Stack Trace (read across, most recent is 1st):
0x0014766c 0x001480b0 0x000b3a38 0x000b411c 0x000b3b78 0x000b76
5c
0x000b10d8 0x000aefd0 0x0001c500
End Of Stack
The second category is the occurrence of a kernel level trap or exception
condition. These usually involve virtual memory and are described below.
A hexadecimal stack trace is also printed.