
Systems Inventory Manager Data Structures

Chapter 1
Data Structures
Introduction
11
Category Design
This section outlines the criteria used to define the categories, the definition of filter attributes, and the GUI
display attributes. The implications of these filters on the Comparison Reports are also outlined.
Because the number of attributes that data collection engine collects can be high, the number of attributes
displayed on the initial screens are limited. As you progress through screens, the level of detail increases to
more specific data groupings.
Logic for GUI Attributes
• The attributes displayed in the GUI should have valid collected values at least 90% of the time. DMI
collects a variety of attributes during data collection. However, all of these attributes may not have values
all the time. Those attributes that will have data at least 90% of the time make good candidates to be
displayed in the GUI.
• Number of columns in a table should not be more than seven columns. The generally accepted number of
columns usually ranges from five to seven, depending on the screen resolution and the length of the
attributes. To adhere to conventions, the number of attributes has been kept to less than seven in almost
all tables except the software category (most of the tables have seven columns)
Logic for Filter Attributes
• You cannot filter attributes that make up the primary keys for the table.
• You cannot filter GUI attributes that are always displayed.
• You cannot filter attributes that cannot be collected through DMI. If DMI does not collect certain
attributes, they are not presented in the filter options for the GUI. The data collection engine at this time
ignores these fields.
Comparison Reports Implications
• Comparison Reports continue to filter at the category level only.
• Comparison Reports perform a comparison of all the elements shown in the Snapshot Parameters
Column of each table.
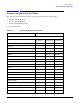
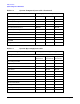
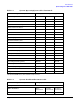
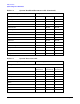
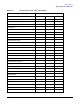
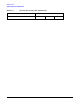
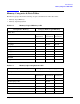
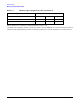
• Mapping of the categories to the table is shown in Table 1-1, “Data Groups & Categories,” on page 10.