
Smart Plug-in for WebLogic Server User's Guide


Chapter 4: Using HP OpenView Reporting and Graphing Features with WLS-SPI
Integrating WLS-SPI with HP OpenView Performance Manager
4-11
LAUNCHING THE WEB PAGE DISPLAY WITH AN OPERATOR
ACTION THAT GENERATE GRAPHS
Performance Manager graphs can be generated from most WLS-SPI alarm
messages by pressing Perform Action from the message details (or Properties) or
from the Message Browser. The operator action launches your Web browser,
which can then display a graph of the metric that generated the message as well
as other related metrics.
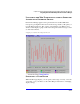
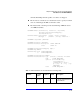
A graph generated from an Operator Action
SPECIFYING A DATE RANGE
Within the Web page display, you can specify a date range of one day, one week,
one month, or one year. Please see the online Help for instructions on changing
display settings.