
Smart Plug-in for WebLogic Server User's Guide


Chapter 4: Using HP OpenView Reporting and Graphing Features with WLS-SPI
Integrating WLS-SPI with HP OpenView Performance Manager
4-9
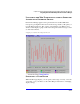
The resulting action displays the metric’s WLS-SPI graph, which charts its
values along with the values of other metrics in the same group.
VIEWING GRAPHS THAT SHOW PAST/CURRENT
CONDITIONS
You can also generate any of the four available graphs manually by using the
WLSSPI-Admin application View Graphs.
To manually generate a graph:
1. At the OVO console open both the Node Bank and the Application Bank
windows.
2. In the Node Bank window select the node for which you want the graph
generated.
3. In the Application Bank window double-click WLSSPI and in the next
window double-click WLSSPI Admin.
4. Drag and drop the node onto the View Graphs application.
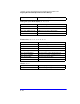
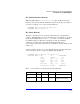
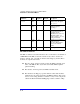
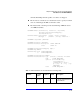
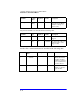
WLS-SPI METRICS AVAILABLE FOR GRAPHS
The four tables that follow show the graphs available for mapping collected
metric values. If you are interested in viewing any one of the metrics included in
any of these tables, you can use the View Graphs application to launch the graph,
which appears in your Web browser.
Server Status (Serverstat); 5, 13, 14, 61, 85, 91
Metric number/name
Metrics Description
B005_JVMMemUtilPct JVM Utilization Percent
B013_ SocketTrafficRt Socket Traffic Rate
B014_AtiveSocketCnt Active Socket Count
B061_JDBCConPlWtCnt JDBC Pool Wait Count
B085_InvLoginAttCnt Invalid Login Atempts Count