
Smart Plug-in for WebLogic Server User's Guide

4-6
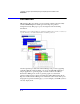
Chapter 4: Using HP OpenView Reporting and Graphing Features with WLS-SPI
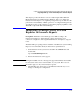
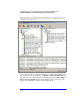
Integrating WebLogic Server SPI with Reporter to Generate Reports
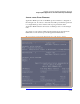
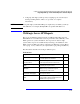
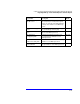
Availability
Single System Reports
TOP 20 EJB Timeout Rate Shows the number of times per minute that
a request timed out while waiting for an EJB
to become available for the top 20 servers.
26
TOP 20 EJB Transaction
Throughput
Shows the average EJB transaction
throughput for the top 20 servers.
35
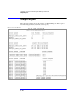
Report Title Description Metric
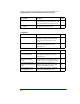
Report Title Description Metric
Server Availability Contains a daily histogram showing the
percentages of uptime, downtime for all
servers. Top 20 execute queues of all
servers.
2
Server Availability Details Contains spectrum graphs showing minutes
of uptime by day and hour for each
WebLogic Server.
2
Report Title Description Metric
JDBC Throughput And
Connection Utilization
Charts the throughput against the utilization
for the JDBC connection pools for each
WebLogic server.
260,
262
Throughput And Utilization
Of JMS Server By Byte
Count
Charts the throughput against the queue
utilization by byte count for destinations on
the JMS servers for each WebLogic Server.
252,
256
Throughput And Utilization
Of JMS Server By Message
Count
Charts the throughput against queue
utilization by message count on the JMS
servers for each WebLogic server.
251,
255
Queue Utilization versus
Throughput On Server
Shows the throughput against the thread
utilization for each WebLogic server.
10,11