
Smart Plug-in for WebLogic Server User's Guide

3-22
Chapter 3: Using and Customizing the WebLogic Server SPI
Using Templates/Applications to View Annotation Reports and Graphs
Using Templates/Applications to View
Annotation Reports and Graphs
Some templates have actions defined with theshold violations or error conditions
that automatically cause reports to appear in the message Annotations. These
reports are snapshots of data values collected form the server around the time
that the alarm occurred.
Other templates have operator actions associated with them that allow you to
generate a graph.
NOTE The reports discussed in this section should not be confused with those
generated by OpenView Reporter, which show more consolidated, historical
data generated as Web pages in management-ready presentation format.
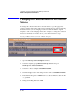
You can access the data as follows:
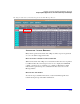
" To view the Message Details. Double-click a message in the OVO
message browser, or just select the message and click Annotations. You
can easily access Annotations by selecting the Annotations button.
Reports are available there, showing data values on a single server.
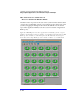
" To view reports. Open both the Node Bank and Application Bank
windows. Continue to open application windows WLSSPI
→WLSSPI
Admin
→Reports. Select a node and drag it onto the WLSSPI metric
report you need. These reports show all server data on a node.
" To view graphs. Open both the Node Bank and Application Bank
windows. Continue to open application windows WLSSPI
→WLSSPI
Admin. Drag a node onto the View Graphs application to launch you
Web browser, which displays the graphing feature available in HP
OpenView Performance Manager (which requires a separate purchase).