
Smart Plug-in for WebLogic Server User's Guide


3-8
Chapter 3: Using and Customizing the WebLogic Server SPI
Basic Template Customizations
"
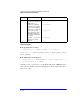
Message Text. Be careful not to modify any of the
parameters—surrounded by <> brackets, beginning with $—in a
message.
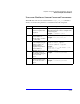
" Actions. This field provides the ability to generate Performance
Manager graphs or reports, or to add custom programs. The reports or
graphs are accessible to the user from:
Automatic action. The automatic action (delivered with the SPI)
generates a snapshot report that show the data values at the time the
action was triggered from an exceeded threshold. You can view the
report in the message Annotations.
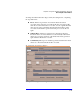
Operator initiated action. The operator action delivered with the SPI
provides that within a message’s details window you can press the
PerformActionbuttontoviewagraph of the metric whose exceeded
threshold generated the message along with other related metric values.
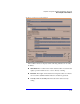
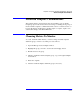
The Condition window, showing a threshold setting of 10 for WLSSPI-0026. The incoming values
for this metric show the total number of times per minute clients must wait for an available
(Enterprise Java) bean; a value of more than 10 would start to impact the server response time the
client experiences, generating a Warning message.
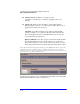
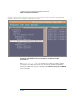
An alarm can be generated once or multiple times, depending on its setting in the
Modify Threshold Monitor window, which shows: