
Smart Plug-in for WebLogic Server Reference Guide

Chapter 1
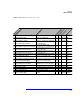
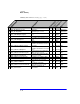
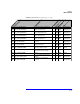
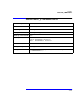
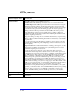
Metric Specification Description
1-9
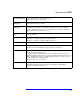
Collection Interval How often the metric is collected and analyzed.
(5 min, 15 min, 1 hour, 1 time daily)
OVO Min/Max
Threshold
Because this setting is the same for all WebLogic Server metrics, which have
maximum thresholds, it is omitted.
Default OVO
Threshold
Shows the default OVO threshold for metrics with parallele monitor templates.
(*=Metrics that should have been assigned a threshold value of 0 are set at 0.5
because OVO alarms must occur at <= or >= values. Since a 0 value would always
trigger an alarm, the threshold is set to 0.5)
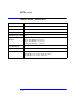
OVO Threshold
Type
Because this setting is the same for all WebLogic Server metrics, which are without
reset, it is omitted.
Message Group To what OVO message group does the metric belong?
(WLSSPI = conditions occuring in the WLS-SPI; and
WebLogic = conditions occuring in WebLogic Server)
Message Text The message displayed for each condition?
Instruction Text Problem-solving information
(Probable causes, Potential impact, Suggested actions, and Reports)
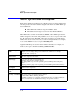
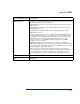
Report Type When a report is available, the method in which it is generated. (Operator initiated,
Automatic, Application Bank, N/A)
Note: All the reports that are automatic actions or operator actions are also in the
Application Bank in OVO. However, metrics that are MeasureWare Only metrics (no
alarms, just MW data) don't have an OVO template for Operator or Auto actions, so
they are ONLY in the Application Bank.
N/A means that no report is planned.
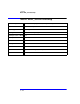
Area The logical area to which the metric belongs.
(Availability, JVM, Performance, Servlets, Web Applications, JMS, JDBC,
Transactions, Security, Time Service)