
HP-UX HB v13.00 Ch-08 - Crash Dumps

HP-UX Handbook – Rev 13.00 Page 4 (of 38)
Chapter 08 Crash Dumps
October 29, 2013
Did you ever experience a system that was hung or crashed unexpectedly? This chapter explains
how to configure a system for crash dump, how to install dump analysis tools, and how to use
them in order to quickly isolate the cause of the problem.
A little bit of theory
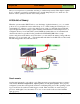
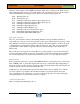
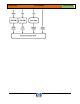
When the system crashes, HP-UX tries to save the image of physical memory (core), or certain
portions of it, to predefined locations called dump devices. Then, during the following reboot, a
special utility (i.e. /sbin/savecrash) is invoked from a rc-script (i.e. /sbin/init.d/savecrash) that
copies the physical memory image together with the current kernel from the dump devices to a
configured directory in a mounted file system (NOTE: the default directory is /var/adm/crash
otherwise the directory specified for the parameter SAVECRASH_DIR in the rc script
/etc/rc.config.d/savecrash will be used). Once there, you can analyze the memory image with any
debugger (e.g. p4, q4, kwdb, gdb, …) that understands and adhere to the HP-UX core file format.
The following picture shows the action flow:
Crash events
An abnormal system reboot is called a crash. There are many reasons that can cause a system to
crash namely hardware malfunctions, software panics, or even power failures. On a properly
configured system, these will typically result in a crash dump being saved. The operating system
logs a crash event for each reason that triggers a crash. There is usually one crash event per-
processor. Although it is not uncommon to see two or more crash events associated with the
same processor.