
HP Systems Insight Manager 7.0 User Guide
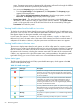
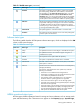
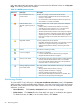
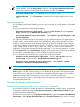
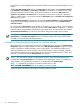
Table Of Contents
- Systems Insight Manager 7.0 User Guide
- Table of Contents
- Part I Introduction
- Part II Setting up HP SIM
- 3 Setting up managed systems
- 4 Credentials
- 5 WMI Mapper Proxy
- 6 Discovery
- 7 Manage Communications
- 8 Automatic event handling
- 9 Users and Authorizations
- 10 Managed environment
- Part III HP SIM basic features
- 11 Basic and advanced searches
- 12 Monitoring systems
- 13 Event management
- 14 Reporting in HP SIM
- 15 HP SIM tools
- Part IV HP SIM advanced features
- 16 Collections in HP SIM
- 17 HP SIM custom tools
- 18 Federated Search
- 19 CMS reconfigure tools
- 20 Understanding HP SIM security
- 21 Privilege elevation
- 22 Contract and warranty
- 23 License Manager
- 24 Storage integration using SMI-S
- 25 Managing MSCS clusters
- 26 HP SIM Audit log
- 27 HP Version Control and HP SIM
- 28 Compiling and customizing MIBs
- A Important Notes
- System and object names must be unique
- Setting the Primary DNS Suffix for the CMS
- Distributed Systems Administration Utilities menu options not available
- Virtual machine guest memory reservation size
- Insight Remote Support Advanced compatibility
- Database firewall settings
- Annotating the portal UI
- Security bulletins
- Validating RPM signatures
- Central Management Server
- Complex systems displaying inconsistency with the number of nPars within the complex
- Configure or Repair Agents
- Data collection reports
- B Troubleshooting
- Authentication
- Browser
- Central Management Server
- Complex
- Configure or Repair Agents
- Container View
- Credentials
- Data Collection
- Database
- Discovery
- iLO
- Linux servers
- Event
- Host name
- HP Insight Control power management
- Insight Control virtual machine management
- HP Smart Update Manager
- Systems Insight Manager
- Identification
- Installation
- License Manager
- Locale
- Managed Environment
- HP MIBs
- Onboard Administrator
- OpenSSH
- Performance
- Ports used by HP SIM.
- Privilege elevation
- Property pages
- Reporting
- Security
- Sign-in
- SNMP settings
- SSH communication
- System Page
- System status
- Target selection wizard
- Tasks
- Tools
- Upgrade
- UUID
- Virtual identifiers
- Virtual machines
- VMware
- WBEM
- WBEM indications
- WMI Mapper
- C Protocols used by HP SIM
- D Data Collection
- E Default system tasks
- Biweekly Data Collection
- System Identification
- Old Noisy Events
- Events Older Than 90 Days
- Status Polling for Non Servers
- Status Polling for Servers
- Status Polling for Systems No Longer Disabled
- Hardware Status Polling for Superdome 2 Onboard Administrator
- Data Collection
- Hardware Status Polling
- Version Status Polling
- Version Status Polling for Systems no Longer Disabled
- Check Event Configuration
- Status polling
- F Host file extensions
- G System Type Manager rules
- H Custom tool definition files
- I Out-of-the-box MIB support in HP SIM
- J Support and other resources
- Glossary
- Index

12 Monitoring systems
Viewing system collections
In HP SIM monitoring systems involves HP SIM polling Insight Management Advisor or firmware
on the managed systems to retrieve status information, and then displays this information as status
icons. There are several types of status that can be displayed, such as Health Status (HW), Software
Versioning Status (SW), or Management Processor status (MP). Other status icons might be added
by plug-ins to HP SIM. These icons enable you to see, at a glance, the state of your systems.
Pages displaying system status
• System lists There are four system lists page views; table view, icon view, tree view, and
picture view (for racks and enclosures). Common in each view is the system name and system
status. To access the system list pages, select a collection or system from the System and
Event Collections panel. The type of collection or system that you select determines the view
that appears.
— Table view The HS column on the system list page displays the overall system health
status, which is determined by the default Hardware Status Polling task and is a roll up
of all the status sources, which can be SNMP, WBEM, HTTP, and cluster status. The legend
shows how many systems in the view are Critical, Major, Minor, Normal, Disabled, and
Unknown.
— Icon view The icon view lists the system name of all discovered systems, as well as the
system health status for each system. The legend shows how many systems in the view
are Critical, Major, Minor, Normal, Disabled, and Unknown.
— Tree view The tree view displays the health status icon and the system name for each
system in a tree format.
— Picture view The picture view page for racks and enclosures contains a picture view
of the discovered systems in the rack or enclosure if available. While signed in to HP
SIM, placing your cursor over a server shown in the view displays information on that
particular server, including server blade name, slot number, and the enclosure in which
the server is located. You can also click a component name to display detailed information
about the component.
In all views, you can select the checkbox next to the system name to select a system. You can
select more than one system, or to select an entire collection, select the checkbox, Select
"collection name" itself.
• System pages On the System Page, System tab, a status icon indicates the overall health
status stored in the database. If system monitoring is suspended, a disabled icon appears in
place of the hardware status icon and software status icon. The System Status section
contains more information on the system status.
You can access the System Page one of the following ways:
— Select Tools→System Information→System Page, and then select a target system.
— Click the system name in the System Name column on the system table view page.
• Property pages The Property page Status tab displays WBEM properties that help
determine the status of the target system, such as determining memory status and process
Viewing system collections 63