
HP Systems Insight Manager 7.2 Technical Reference Guide

When switching between the System(s) tab and the Events tab, the Events tab "remembers" the
selected events and event filter (if viewing a system collection). The System(s) tab remembers the
selected systems, view type (table, tree, or icon), and the selected system filter (if viewing an event
collection). However, the selections on each page are independent of each other.
Quick Launch
The Quick Launch hyperlink links to a short list of frequently used tools. Place your cursor over the
link to expand the menu and view the tools available for selected systems. Selecting a tool from
this list bypasses the target verification page of the Task Wizard. You cannot schedule tools
launched from this menu. Customize this menu by clicking the Customize link in the Quick Launch
menu.
Event status summary
This summary shows how many events in the view have a status of Critical, Major, Minor, Normal,
and Informational. For more information about event status types, see the HP Systems Insight
Manager User Guide, at http://www.hp.com/go/insightmanagement/sim/docs.
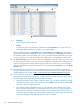
Event collection columns
To sort collection results by a particular column, click the column header for ascending or descending
order. Place your cursor over a column name for a brief description of the column. The following
columns appear on the event table view page:
• Select the checkbox in this column to select an event. You can select more than one event.
Select the checkbox in the column heading or select Select "collection name" itself to
select or clear all displayed events.
• This column displays whether the event is in the Cleared or Not Cleared state. Events start in
the Not Cleared state. A Cleared state means the user is no longer interested in this event.
Event states also include In Progress, which indicates that not all the data for the event has
been logged. You cannot remove or clear In Progress events. Pending state events are changed
to Not Cleared when the CMS is restarted.
• This column displays the event status icon to indicate the severity of a problem represented
by the event. For more information on event severity types, see the HP Systems Insight Manager
User Guide, at http://www.hp.com/go/insightmanagement/sim/docs.
• This column displays the type of an event. Some examples of event types include: SNMP traps,
login failures, or the replicate agent settings tool. Select an event type from the list to view the
Event Details section. The information displayed varies depending on the event. If you cannot
see the entire event type in the column, place your cursor over this field, and a window appears
showing the entire event type. For more information abut event details, see the HP Systems
Insight Manager User Guide, at http://www.hp.com/go/insightmanagement/sim/docs.
• This column displays the system name on which the event occurred. Clicking a link in this
column displays the System Page for the selected system.
When an event occurs that affects an entire rack or enclosure, it is possible for several systems
in that rack or enclosure to generate a trap for that event. These container traps are filtered
such that only one event is logged per rack or enclosure trap. Also, even though the source
of the trap is a server blade or management processor, HP SIM sets the Event Source and
Associated System for the logged event to the rack or enclosure, as appropriate. For more
information on racks and enclosures, see the HP Systems Insight Manager User Guide, at
http://www.hp.com/go/insightmanagement/sim/docs.
• This column displays the time stamp when the CMS received the event, which includes the
date and time. If the client is in a different time zone than the event time (CMS time), the event
time is converted to the client time zone.
88 Screens and product layout