
HP Systems Insight Manager 7.2 Technical Reference Guide
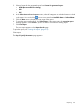


2. See Additional Details.
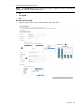
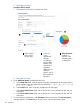
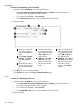
Procedure 203 Pie Graph
1. Select options to be used to create the Pie Chart.
321
Chart Previewer
displays a
preview of the
selected options
in chart form.
Additional
Details
dynamically
changes
according to
the type chart
selected. This
information is
populated
depending on
selected
options. Any of
these fields can
be edited.
Select options
to be used in
the pie chart.
2. See Additional Details.
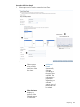
2. Under Additional details: complete the following:
a. In the Graph Title: field, enter the title for the graph, prompted for all chart types. Report
names cannot contain any of the following characters: < >' & \ ` , # + | % ; / \\ ! ~ @
$ ^ * = { } [ ] " : and ?
b. In the Footer: field, enter a footnote, prompted for all chart types.
c. In the Series Label (X axis): field, enter a label for the X axis, prompted for Bar and Line
chart types.
d. In the Series Label (Y axis): field, enter a label for the Y axis, prompted for Bar and Line
chart types.
3. To save the report configuration, click Save Report. If the report exists, the overwrite report
message appears. Click Cancel if you do not want to overwrite the existing report.
326 Operations