
Configuring HP SIM for Optimal Performance in Large Environments

Network Interface Object
o
Output Queue Length
o
Bytes Total per second
Processor Object (for CPU monitoring)
o
Percent Total Processor Time
o
Queue Length
In general, if an application is running at over 70% CPU utilization and a queue is forming, dig deeper
to determine which system resource is holding back the performance of your Microsoft Windows 2008
system.
Configuring the logging feature
Note:
Please note that the Windows Performance Monitor is a very powerful and
feature rich application. In addition to the Help feature, there are many
articles available online regarding relevant settings and counters details.
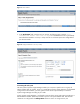
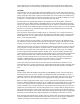
1. In the Administrative Tools program group, start the Performance Monitor.
2. Click the logging toolbar button (the drum).
3. Expand Data Collector Sets
User Defined
in the left panel tree, right click on
User
Defined
, and select
New
Data Collector Set
.
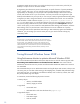
4. Enter the name of your new data collector.
5. Select Create from a template, and then click Next.
6. Select the System Performance template, and then click Next.
7. The next page will prompt for a destination folder for data. Consider potential data file size when
choosing the destination folder, as you may want to log performance data to a separate location.
8. Click Finish.
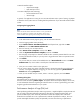
You will note that your counter will be added to the list of User Defined counters in the Data
Collector Sets tree, which resides in the left pane of the Performance Monitor.
9. Click your new counter to load it in the right pane.
10. If you want to change any aspect of the data collector, change the output file type, add/remove
counters, or change the frequency of logging, you can do so by right-clicking Performance
Counter and selecting Properties.
11. Once you are satisfied with your counter, select it in the tree, right-click, and select Start.
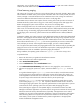
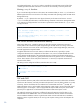
Examining the log data
Automated reports for performance counters can be generated and viewed by right-clicking the
desired counter and selecting Latest report. The Systems Performance Report displays an overview,
as well as detailed information regarding all selected counters. It can be a good starting point when
diagnosing performance bottlenecks on your system.
Performance
Analysis
of
Logs
(PAL)
tool
When
performing
performance
analysis
and
tuning
activities,
it
might
be
helpful
to
employ
the
PAL
tool.
PAL
can
analyze
Windows
Performance
Monitor
log
files
utilizing
common
threshold
values,
and
present
an
HTML
report,
which
charts
the
performance
counters
and
displays
alerts
when
those
thresholds
are
exceeded.
PAL
is
not
a
replacement
for
methods
of
performance
analysis,
but
it
can
provide
meaningful
information
quickly
and
potentially
save
time
when
focusing
on
performance