
Configuring HP SIM for Optimal Performance in Large Environments

12
arrangement might not be practical, nor would it be likely that you would want to poll all of your
desktops or all your servers on the same schedule.
By segmenting the collections by areas of responsibility or specific functions of systems (Exchange
servers, clusters, and so on), you can configure Systems Insight Manager to poll these systems
appropriately. For example, you can poll your most important Exchange or SQL servers once per
minute, and all other servers in your environment, once every 30 minutes. You might want to poll
desktops and notebooks only once per day or even once per week (using the DMI Status Polling task).
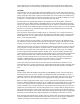
To segment your tasks, change the collection to which the default tasks are tied. You can edit these
tasks and select a smaller collection set (like Systems by Name or All Systems within X
Range). As a starting point, you can edit the collection criteria for the system default collections so
that you are polling a reduced set of systems instead of being tied to the All Systems collection
criteria. At this point, you must create new tasks (Hardware Status Polling, Data Collection, Software
Status Polling, and so on) and tie them to other collections that cover a different set of systems.
By creating several like tasks (Hardware Status Polling or Data Collection) against several different
collections, you can manage your network exactly the way you need to without inducing any
unnecessary traffic.
Note:
The task system is a serialized system for like tasks. This means that if you
create two data collection tasks, the first task executes and runs to completion.
The second task, if you scheduled it to execute in the same time period,
remains queued until the first task has completed. This means that two data
collection tasks do not run at the same time. If you have two dissimilar tasks,
such as Hardware Status Polling and Data Collection, then they execute
simultaneously.
Tuning Microsoft Windows Server 2008
Using Performance Monitor to optimize Microsoft Windows 2008
You can find the Microsoft Windows Performance Monitor that was used for most tuning tests under
Start
Programs
Administrative Tools
Performance Monitor
. Use caution with the
Performance Monitor because many counters and all Microsoft® Windows® 2008 servers resources
are interrelated.
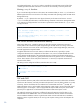
HP recommends that you turn on Performance Monitor and log all objects and counters so that you are
not missing one you want later. When setting up the sampling times, remember that performance logs
grow large over time. To avoid being overwhelmed with data, look at a few key counters, then when
they show problems, dig a bit deeper.
At a minimum, monitor the following objects and counters:
Memory Object
o
Memory: Available Mbytes
o
Memory: Pages per second
Logical Disk
o
Percent Disk Time
o
Dedicated disk or disk drive that houses the
pagefile.sys
Logical Disk Object
o
Percent Disk Time
o
Disk Queue Length
o
Disk sec/transfer