
HP StorageWorks Storage Mirroring Reporting Center user's guide (T2558-96324, April 2009)

5 - 22
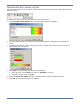
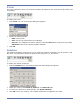
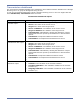
To change any of these parameters:
1. Click the Bar 3D Option icon. The Bar Chart 3D Option Editor dialog box.
2. Change any of the parameters by sliding the relevant slide bar and observe the changes to the
appearance of the report in the Report window.
z Elevation—Controls the viewing elevation of the chart. Higher values move the viewing angle
towards the top.
z Rotation—Rotates the bar chart. Higher values move the viewing angle towards the right.
z Depth—Depth controls the thickness of the bar chart along the Z axis. A depth of zero makes
the chart a standard 2D chart.
3. Click OK.
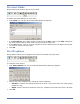
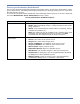
Chart labels
Some charts provide the ability to display a data value in a label above the bar or piece of pie.
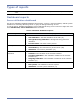
To enable chart labels:
1. Click Chart Label icon. The Chart Label Editor dialog box appears.
2. Select the Enable chart labels checkbox. To disable chart labels, deselect the Enable chart
labels checkbox.
3. In the Anchor field, select the location for the chart labels.
4. In the Color field, select a color for the chart labels from the list of values. Select Edit from the
drop-down list to launch the Color Properties dialog box.
5. In the Font field, select the Default checkbox to use the values defined in the User
Preferences dialog box. Deselect this checkbox and click Font to launch the Font Properties
dialog box.
6. Click OK. The report is updated with your changes.