
HP StorageWorks Storage Mirroring Reporting Center user's guide (T2558-96324, April 2009)

5 - 1
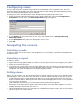
Viewing Reports
You can run reports from group objects or individual nodes in the
Navigation tree. When generating a report for a group object, the
results include the data for all nodes within that group. In addition,
you can compare the performance of one object to another object
by running comparison reports. To do this, select multiple objects using Control + Click from the
Navigation tree. The resulting report displays a comparison of these two objects for the report
specified.
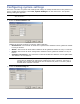
Running reports
After adding a node to be monitored, you can try running a report against the node you have added
using the following steps.
1. In the navigation tree, select the node that you want to run a report against.
2. Select the time period that you want to run a report against from the Window drop-down box
on the main tool bar. For more information, see Selecting a reporting time period on page
5-7.
3. Right-click the node and select a report from the list of reports available on the pop-up menu.
For more information about available reports, see Types of reports on page 5-28.
4. The report will be run and the results displayed in the right-hand side of the user interface.
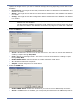
Printing reports
To print reports:
1. Generate the report you want to print, then select File, Print Report.
2. If you are printing graphs or charts, the Print dialog box appears.
a. Specify the print settings
b. Click Print.
3. If you are printing a table, the Print Preview dialog box appears.
c. You can set up the margins, page orientation, and paper size/source by clicking Page
Format. The Page Setup dialog box appears. Enter your settings, then click OK.
d. If the table spans many pages, you can view other pages by clicking Previous, Next, and
Last.
e. To print just the page that is displayed, click Print. To print all of the pages associated with
the Summary Report, click Print All.
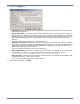
Saving reports
You can save reports from the GUI to several formats including comma separated values, images,
pdfs, and web pages.
To save a report:
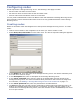
1. Generate the report, then select File, Save Report. A dialog box appears so that you can
specify the name of the file and its file type.
2. Navigate to the location where you want to save the report.
NOTE: After you change the timeframe, either click the Refresh icon or press F5 to update the
data.