
HP StorageWorks Scalable File Share System User Guide Version 2.2

Viewing system information4–20
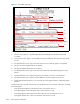
4.7.2 Overview of the information gathered by the collectl utility
The collectl utility gathers the following information for each individual server:
• Memory usage
• Total slab memory
• Total mapped memory
• Total buffer memory
• Total cache memory
• Total or Individual CPU utilization
CPU usage graphs are stacked; that is, each successive item is plotted with the value of the previous
item as its y-axis 0 co-ordinate.
•User percentage
• Wait percentage
• System percentage
•Nice percentage
• Context switches/Interrupts per second
• Total or Individual Disk Usage
• Megabytes read per second
• Megabytes written per second
• Lustre Statistics
• Total and Individual OST statistics
• Megabytes read per second
• Megabytes written per second
•MDS statistics
•Number of close operations per second
•Number of getattr operations per second
•Number of reint operations per second
This is a counter for all setattr, create, link, unlink, rename and open operations
that occur on the file system.
•Number of sync operations per second
This is a counter for the number of sync operations that are called on the file system.
• Total or Individual Network usage
• Megabytes received per second
• Megabytes sent per second
• Number of packets received per second
• Number of packets sent per second
• Process counters
• Number of new processes started per second
• Number of processes queued and waiting to be run per second
• Number of processes running per second
• Network sockets
•Number of open tcp sockets
•Number of open udp sockets
•Number of open raw sockets